Longitudinal Trend of Prevalence of Meeting Physical Activity Guidelines among Korean Adults
Article information

Abstract
OBJECTIVES
At present, almost nothing is known about longitudinal trends in the proportion of Korean adults meeting recommended guidelines for physical activity or the inter-related factors. The purpose of this study was to investigate the longitudinal trends in how Korean adults met new guidelines for physical activity between 2008 and 2013 and to evaluate a range of factors that could have influenced these trends.
METHODS
Analysis involved a dataset of 36,009 adults aged ≥20 years who participated in the Korea National Health and Nutrition Examination Survey 2008-2013. The volume of physical activity and muscular activity were assessed using a self-reported questionnaire, and each domain of activity was characterized as being either low or high, based upon physical activity guidelines for Korean adults.
RESULTS
Based on new physical activity guidelines, 22.0%, 26.6%, and 36.8% of Korean adults met the guideline requirements for moderate, vigorous, and moderate-to-vigorous physical activity, respectively; 21.8% adults met the requirements for muscular activity. The odds ratio for meeting the requirements of the physical activity guidelines was significantly lower in the elderly population, infemales, and in participants with low income. Moreover, the longitudinal trend for meeting the guidelines for physical activity showed a significant reduction from 2008 to 2012.
CONCLUSIONS
In conclusion, the self-reporting questionnaire used in the present study showed that ~35% of Korean adults met the guidelines for physical activity. Furthermore, the longitudinal trend for meeting physical activity guidelines showed a significant reduction between 2008 and 2012. Finally, our findings showed that physical activity estimates for Korean adults vary substantially depending on socio-demographic characteristics.
INTRODUCTION
A growing body of evidence indicates that regular physical activity (PA) has many benefits for health including improved cardiorespiratory fitness and muscular strength, reduced body fat, reduced symptoms of depression and/or anxiety, enhanced bone health, improved cardiovascular health and reduced risk for diabetes, cardiovascular diseases, and premature mortality [1-5].
In 2013, the Korea Ministry of Health and Welfare (MHW) published a series of PA recommendations for Korean adults [6]. According to these guidelines, in order to gain substantial health benefits, adults should accumulate at least 150 min/week of moderate-intensity physical activity (MPA), or at least 75 min/week of vigorousintensity physical activity (VPA), or an equivalent combination (≥150 min/week) of moderate-to-vigorous physical activity (MVPA), and engage in muscle-strengthening activity for at least 2 days/week [6]. However, there is a gap in our existing knowledge about how many Korean adults actually engage in levels of PA, which are sufficient to meet these guidelines.
At the population level, physically inactive lifestyles are common; this has led to substantial health burden and may be associated with an increased socioeconomic burden. Previous studies have reported that meeting the minimum levels for PA was associated with reduced risk of diabetes, metabolic syndrome, and cardiovascular disease (CVD) [2,3,7]. However, although many studies have reported this positive association between PA and reduced risk for chronic diseases, there is only limited information on how these specific guidelines are met by the Korean population. Moreover, there is a clear lack of evidence as to what proportion of the adult Korean population actually meet the current PA guidelines.
For effective public health surveillance, it is important to determine the proportion of the Korean adult population, which meets the requirements for PA outlined in the official guidelines. Although the guidelines for Korean adults are similar to other recommendations [8], it is important to understand how these guidelines may specifically affect national data and public health surveillance.
The purpose of the present study, therefore, was to assess trends in the proportion of Korean adults who met PA guidelines using data from the Korea National Health and Nutritional Examination Survey (KNHANES), carried out during 2008-2013. From this national dataset, we selected a representative sample of Korean adults for further analysis.
METHODS
Study Population
The KNHANES is an ongoing series of cross-sectional surveys using a stratified and multi-stage probability cluster design with nationally representative samples from the non-institutionalized civilian population in South Korea [9,10]. In the present study, we used a dataset of 40,328 adults aged ≥ 20 years who participated in the KNHANES between 2008 and 2013. We first excluded 3,314 participants due to missing data for MVPA and muscular PA. We also excluded a further 352 participants due to missing data for body mass index (BMI) and 653 participants due to missing data in relation to demographic and lifestyle factors. Consequently, 36,009 participants were included in the final analysis. Our survey protocols were approved by the Institutional Review Board of the Korea Centers for Disease Control and Prevention, and all participants provided informed written consent.
Physical Activity
The volume of PA was assessed using the International Physical Activity Questionnaire (IPAQ) short form. The IPAQ assesses three types of activity (walking, MPA, and VPA) undertaken across a comprehensive set of four domains: leisure time, household/gardening, work-related, and transport-related PA [11]. The IPAQ is the most commonly used tool to assess PA. All participants were asked to report the type (intensity), frequency (days), and duration (hours) of PA undertaken over the past 7 days. To assess muscular activities, participants were asked the following question: “Over the past 7 days, did you do any physical activities specifıcally designed to strengthen your muscles such as lifting weights, push-ups, or sit-ups?” Those participants who answered ‘yes’ to this question were then asked to provide a frequency for their participation. We categorized participants who reported undertaking at least 150 min a week of moderate-intensity, or 75 min a week of vigorous-intensity PA, or an equivalent combination of moderate- and vigorous intensity activity, and thus met the MVPA based on the recommendations for aerobic activity described by the Physical Activity Guidelines for Korean 2013 (PAGK 2013) [6]. Muscular activity levels were categorized as either high (≥2 days/ week) or low (<2 days/week) [6].
Assessment of Other Variables
Several other parameters were investigated as potential factors related to a subject’s decision to carry out PA, including demographics (age, sex, educational level, and household income), health-related behaviors (current smoking status and alcohol consumption), and obesity. Household income was classified in terms of quartiles of the overall population for each year. Educational level was classified into three groups: less than high school; high school; or greater than high school. Alcohol consumption was categorized as never, ≤once a week, 2–3 times/week, or ≥4 times/week. BMI was calculated from body weight and height (weight/height2), and categorized into two groups, which were defined as either normal or obese (BMI <25 and ≥25 kg/m2).
Statistical Analysis
All data were analyzed using R version 3.4.1 (R Foundation for Statistical Computing, Vienna, Austria) [12]. We considered P-values <0.05 as statistically significant. The characteristics of our subjects were presented as weighted percentages. To compare the prevalence of meeting PA guidelines with participant characteristics, we used chisquared tests. Survey logistic regression analysis was used to estimate the odds ratio (OR) and 95% confidence interval (CI) of meeting the requirements for the PA guidelines in relation to the characteristics of the participants. Longitudinal trends in how subjects met PA guidelines were estimated using the Cochran–Armitage test.
RESULTS
Table 1 shows the general characteristics of our subject population, which was based on a national representative sample of 36,009 participants who answered the KNHANES between 2008 and 2013; subjects were selected because they represented the nation as a whole. Based on the new PAGK 2013, 22.0%, 26.6%, 36.8% of Korean adults met the MPA, VPA, and MVPA guidelines, respectively (Table 1). Of the study population, 21.8% subjects met the requirements for meeting muscular PA.
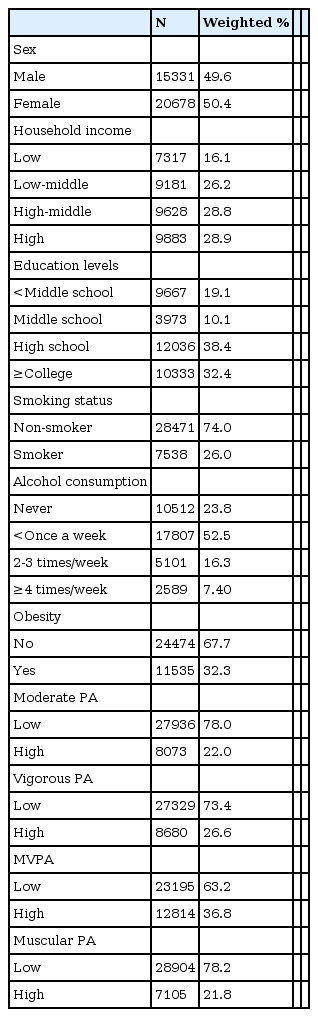
Study participants characteristics
Table 2 shows the frequency of participants who met each PA guideline in relation to a range of characteristics. The prevalence of meeting PA guidelines was significantly higher in participants who were aged 40-59 years, were males, had a higher household income, were better educated, and in those who smoked, were obese, or had a higher frequency of alcohol consumption (Table 2).

Prevalence of meeting physical activity guidelines in Korean adults.
Table 3 shows the results of Multivariate Logistic Regression models involving subjects who met PA guidelines and the ORs of participant characteristics. The ORs for meeting PA guidelines (MPA, VPA, and MVPA) were significantly increased in participants who were aged 40-59 years and were significantly decreased in participants aged ≥60 years compared with those aged 20-39 years. However, the OR for meeting the muscular PA guideline increased significantly with age (Table 3). The ORs for meeting each PA guideline were significantly lower in females than males. Higher income and higher educational levels were significantly associated with an increased OR for meeting PA guidelines.
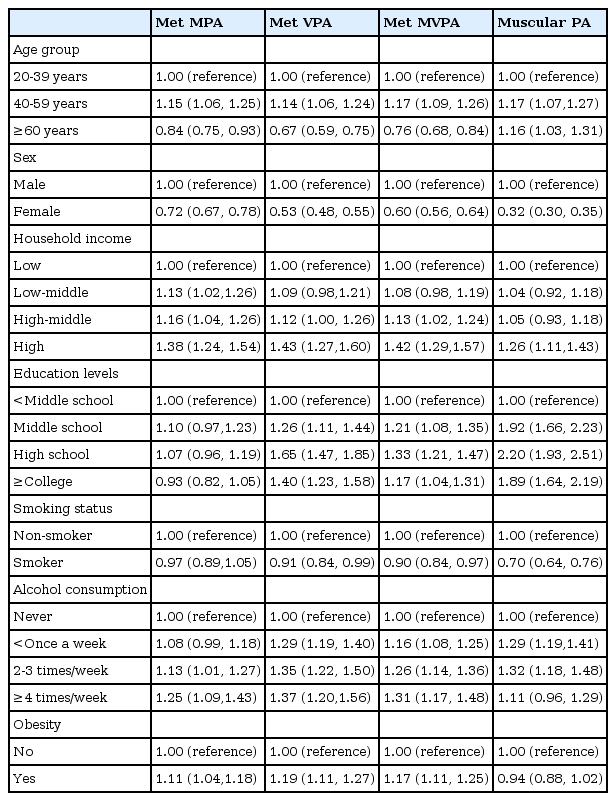
ORs (95% CIs) for meeting the physical activity guidelines in Korean adults.
Figure 1 shows the longitudinal trend for meeting MVPA and muscular PA guidelines between 2008 and 2013. The longitudinal trend for meeting the MVPA guideline indicated a large reduction over time, from 41.8% in 2008 to 30.8% in 2012 (P for trend<0.05), although there was a slight increase in 2013 (36.3%). However, the prevalence of meeting the muscular PA guidelines did not change much between 2008 and 2013 (21.1% in 2008 and 22.4% in 2013).

Longitudinal trends for Korean adults meeting physical activity guidelines
Values are shown as weighted % (SE)
DISCUSSION
The present study investigated the prevalence of meeting new PA guidelines for Korean adults and attempted to identify the socio-demographic factors, which contributed to their engagement with the recommended PA guidelines. Our analysis involved a nationally representative sample of Korean adults who completed the KNHANES between 2008 and 2013. Data showed that approximately 30% of subjects reported meeting the MVPA guideline, while only 20% reported meeting the muscular PA guideline. Moreover, we found that age, sex, income, educational level, current smoking status, and alcohol consumption were significantly associated with meeting MVPA and muscular PA guidelines. Additionally, trend analysis over the six-year period of data showed that the prevalence of meeting the MVPA guideline decreased significantly with time, from 41.8% in 2008 to 30.8% in 2012, although there was a slight increase in 2013 (36.3%). These fındings can therefore be used as a comparison when evaluating any trends in prevalence over subsequent periods.
This study is, to the best of our knowledge, the first to investigate how Korean adults meet the new Korean new guidelines for PA. Korean government reports the levels of PA on an annual basis. However, it is not known whether these PA guidelines are met by Korean adults. In general, meeting the recommended levels of PA is known to be beneficial in improving the general health and preventing chronic diseases [5,13,14]. To increase the proportion of Korean adults meeting the PA guidelines, it is important to identify the interrelationships or determinants of participation in PA. This would allow us to develop tailored interventions that target risk populations. In addition, it is very important to examine both aerobic and muscular PA guidelines separately; this practice could help to identify public health targets according to socio-demographic and obesity. Moreover, the proportion of subjects meeting any type of PA guideline may be lower in certain groups of adults, thus requiring target strategies to be set for the specific needs of a particular sub-population.
However, the proportion of Korean adults meeting PA guidelines was lower than those reported previously from other countries using guidelines published by the CDC. Approximately 62% of adults in the USA met the requirements of the PA guidelines for Americans 2008 when using the moderate-to-vigorous PA calculation method recommended by the authors [15]. Data from the Behavioral Risk Factor Surveillance System (BRFSS) further showed that 64.5% of USA adults obtained sufficient PA to meet the guidelines [16,17]. Therefore, public health strategies should be established which aim to increase the population who meet the Korean guidelines for PA.
The present study found that the proportion of subjects meeting PA guidelines was higher in males compared with females. In addition, these tendencies were more pronounced in the case of muscular PA. There are several potential explanations worth considering for this apparent difference in PA levels [18,19]. Previous studies reported that when females are not involved in routine paid work, or engaged in specific activities, such as shopping for groceries, a significant proportion of their time is spent in unstructured generic family caregiving and household tasks, which are unlikely to be recalled and reported as PA in response to generic survey questions.
Moreover, our findings suggest that the most vulnerable subjects for MVPA within the study population were those with a lower income, those who had a lower educational background, and those who smoked. In addition, participants with a lower income, lower level of education, and those who smoked were vulnerable for muscular PA. These results were similar to those reported previously by the SUVIMAX [20] study and the BRFSS [16,17] study. Collectively, these studies suggest that participants with higher education levels may be more aware of the benefits of meeting PA guidelines in terms of disease prevention and health promotion. The present investigation will contribute to the development of interventions aiming to promote PA among the large population of Korean adults. Differences in the association between demographics may indicate that specific interventions or approaches may be needed. The major strength of this study was that it included a large, representative sample of the general Korean population. However, this study has several limitations, which need to be taken into consideration. Because the KHANES is a cross-sectional survey, we could not infer temporality. In addition, PA was assessed via a self-reported questionnaire, which carries the possibility of bias. It is difficult to obtain a completely accurate dataset using questionnaires.
CONCLUSIONS
In conclusion, our analysis of self-reporting questionnaires showed that ~35% of Korean adults met the PA guidelines. We also found that the proportion of Korean adults meeting the MVPA guideline fell significantly. Moreover, PA estimates among Korean adults are known to vary substantially and depend on socio-demographic characteristics and health condition. Further studies relating to the promotion of PA in the Korean population are urgently required to specify the target population and develop effective public health programs.
Acknowledgements
This work was supported by the Basic Science Research Program through the National Research Foundation of Korea funded by the Korea Ministry of Education (Grant No. 2014R1A1A2059106).
Notes
Conflicts of interest
The authors declare no conflicts of interest.