Cardiovascular Fitness and Associated Comorbidities in An Executive Health Program
Article information
Abstract
OBJECTIVES
Low cardiorespiratory fitness, defined as a VO2 max below the 25th percentile for age and sex, is associated with greater body mass index (BMI), blood pressure, and plasma cholesterol values and is an independent risk factor for cardiovascular and metabolic diseases. Given that sedentarism has substantially increased in the U.S. population in the last 20 years and that office workers have the lowest cardiorespiratory fitness of the workforce, we aimed to assess the prevalence of low cardiorespiratory fitness in an corporate wellness program and determine its relationship with associated comorbidities.
METHODS
For this retrospective observational analysis demographics, height, weight, blood pressure at rest, plasma glucose, lipids, comorbidities, and VO2 max data was extracted from the medical records of 199 participants attending the Executive Health Program at M Health Fairview of the University of Minnesota. Participants were predominantly white, middle-aged men with near-optimal blood pressure values.
RESULTS
Participants with low cardiorespiratory fitness had a VO2 max [mean (range) of 28 (19.4 - 36.1) mL/kg/min], and was observed in 33% of all participants. Participants with low cardiorespiratory fitness were more likely to have higher BMI, dyslipidemia and hypertension than those in the excellent to superior category of cardiorespiratory fitness, VO2 max [mean (range) 45.6 (31.8 - 61.2) mL/kg/min]. Prevalence of obesity (17%) was lower than in the general U.S. population, and those who were obese were more likely to be of low cardiorespiratory fitness. Those with low cardiorespiratory fitness had a four fold relative risk of belonging to the group at high risk of cardiovascular and metabolic diseases when compared to those with a fair to superior cardiorespiratory fitness.
CONCLUSIONS
Low cardiorespiratory fitness identified in a third of all participants, is a modifiable risk factor associated with risk for cardiovascular and metabolic disease, should be evaluated in executive health programs.
INTRODUCTION
Corporate wellness programs have increased in popularity since the late 1970s when Johnson & Johnson live for life® program would become the blueprint for future corporate wellness programs [1]. Employers and researchers observed a positive correlation between overall health and job performance. Thus employers began to offer health-related programs aimed at smoking cessation, stress management, improving nutrition and weight management, and increasing cardiorespiratory fitness [2].
Cardiorespiratory fitness serves as an essential health parameter due to its inverse association with the incidence of cardiovascular disease (CVD) mortality [3] and diabetes [4]. In addition, low cardiorespiratory fitness is predictive of disability rates [5] and is positively associated with memory function [6]. Cardiorespiratory fitness decreases with age and is higher in males than in females [7] and varies by occupation [8]. For example, fields with the highest cardiorespiratory fitness were observed among male construction workers and female construction trade workers. In contrast, the lowest cardiorespiratory fitness was seen in males and females who performed sedentary jobs such as farm machine operators, office managers, and supervisors [8]. In addition, individuals with lower cardiorespiratory fitness were more likely to have higher body mass index (BMI) and waist circumference [9], higher systolic blood pressure [9,10], plasma glucose [10], triglycerides [9], total cholesterol [9,11], and lower levels of high-density lipoprotein cholesterol (HDL-C) [11]. These associations partially explain the relationship between low cardiorespiratory fitness, increased mortality from CVD, and increased incidence of diabetes.
The American College of Sports Medicine (ACSM) Guidelines for Exercise Testing and Prescription [12] identifies those with VO2 max below the 20th percentile for their age and sex as having very poor to poor cardiorespiratory fitness. This cutoff value was based on research that showed a two- to five-fold increase in CVD or all-cause mortality among individuals with VO2 max values in the lowest quartile or quintile (low cardiorespiratory fitness), independent of other risk factors [13,14].
Sedentary behavior, increased among U.S. adults by 72% between 2001-2016 for in and outside of work activities [15]. Furthermore, sedentary behaviors are inversely associated with low cardiorespiratory fitness [16], and with an increased risk of cardiovascular disease [17], metabolic syndrome [18], diabetes, cancer [18], and overall mortality [19]. The rising sedentary behavior among office workers [20] would predict that the prevalence of low cardiorespiratory fitness is also higher in this group of individuals. However, the prevalence of low cardiorespiratory fitness among office workers and executives from the corporate wellness programs is unknown.
Therefore, the purposes of this paper are 1) to describe the prevalence of low cardiorespiratory fitness of those attending a corporate wellness program, 2) to assess the association between cardiorespiratory fitness and levels of BMI, plasma glucose, lipids, blood pressure, 3) to determine if the prevalence of dyslipidemia and hypertension is greater in those with low cardiorespiratory fitness, 4) To determine the levels of plasma glucose and lipids, VO2 max and number of comorbidities by categories of BMI, and 5) to examine the association low cardiorespiratory fitness and the relative risk of being in a high-risk category for cardiovascular and metabolic diseases. The finding from the present study may highlight the importance for clinical centers of assessing cardiorespiratory fitness as a biomarker for overall cardiovascular and metabolic health.
METHODS
Research Design
This study is a retrospective observational analysis of participants attending a corporate wellness program in the M Health Fairview Executive Health program at the University of Minnesota. An Institutional Review Board (IRB) exemption was approved by the University of Minnesota IRB committee (# 11775, 12/22/2020). Data for this analysis were extracted from electronic medical records of participants who had attended the Executive Health program at M Health Fairview between June 2016 and December 2020 and provided to us in a de-identified manner and following Health Insurance Portability and Accountability Act (HIPAA) regulations. Data extraction and processing were provided by the Clinical and Translational Science Institute (CTSI) of the University of Minnesota and the Data and Informatics and Best Practices Integrated Informatics Core (BPIC). The M Health Fairview Executive Health program was initiated in 2016 with the purpose of providing single-day comprehensive preventive health evaluations to busy professional from companies located in the Metro Twin Cities area of Minneapolis/Saint Paul, MN.
Participants
Participants attending the M Health Fairview Executive Health program self-select between the Gold and Maroon service. Those selecting the Gold service performed a graded exercise treadmill test to measure VO2 max and were provided with an exercise prescription provided by an exercise physiologist with at least a master's level degree. Included were all participants with a VO2 max flowsheet measurement were identified as a Gold group members starting in June 2016 and no later than December 22, 2020. Inclusion criteria included an age range between 21 – 75 years of age, without limitations to perform moderate to vigorous physical activity and without overt cardiovascular disease. A total of 199 out of 210 participants consented to research and had completed at least one Executive Health Fitness Action Plan with a measurement of VO2 maximum (max). In addition, 19 participants performed an exercise test during a second visit [mean (SD) follow-up visit 1,44 (0,51) years], but we decided not to publish those results because of the low number of individuals.
Measures
Demographics: age, sex, race (whites, African American and Asian), self-declared ethnic group (Hispanic/Latino or non-Hispanic or Latino), and social history (alcohol intake, smoking, illegal drugs use) were reported to the nurse or medical assistant and documented in their medical records. Physician-diagnosed comorbidities were gleaned from medical records. Vitals signs and anthropometrics (i.e., resting heart rate, systolic and diastolic blood pressure) were measured using an automated blood pressure device after 5 minutes of rest. Height and weight were measured following standard clinical procedures. Participants attended their appointment after fasting for at least 8 hours. Lab values such as plasma glucose and lipids (total cholesterol, low-density lipoprotein-cholesterol (LDL-C), high-density lipoprotein (HDL-C), and triglyceride) were measured at the Fairview Hospital Central Laboratory.
A graded exercise test determined VO2 max using the Bruce protocol [12] measured in mL of O2/kg of body weight/min using a metabolic cart gas analyzer Breeze Suite 8.6. (MGC. Diagnostics, St. Paul, MN). When indicated, a modified Bruce protocol was utilized based on the exercise physiologist's judgment. Heart rate was measured continuously during the VO2 max test using a Polar T31 heart rate monitor that connected wirelessly to the metabolic cart Breeze Suite. Exercise tests were terminated when participants reached volitional exhaustion (RPE ≥ 18). VO2 max was confirmed by respiratory exchange ratio (VCO2/VO2) > 1.10 and a heart rate within ten bpm of the estimated maximal heart rate. The gas analyzer and flow rates were calibrated before all VO2 max testing.
A graded exercise test determined VO2 max using the Bruce protocol [12] measured in mL of O2/kg of body weight/min using a metabolic cart gas analyzer Breeze Suite 8.6. (MGC. Diagnostics, St. Paul, MN). When indicated, a modified Bruce protocol was utilized based on the exercise physiologist's judgment. Heart rate was measured continuously during the VO2 max test using a Polar T31 heart rate monitor that connected wirelessly to the metabolic cart Breeze Suite. Exercise tests were terminated when participants reached volitional exhaustion (RPE ≥ 18). VO2 max was confirmed by respiratory exchange ratio (VCO2/VO2) > 1.10 and a heart rate within ten bpm of the estimated maximal heart rate. The gas analyzer and flow rates were calibrated before all VO2 max testing.
Statistical Analysis
Data were expressed as mean (SD) or percentages for continuous and categorical variables, respectively. General linear models and Chi-square tests were used to determine differences among groups for continuous and categorical variables, respectively. Age groups were formed using age values <, at and, > the interquartile (IQ) range. Accordingly, the following age categories were formed 21-42, 43-55, and 56-75 years, respectively.
For the purpose of this study, we defined those with a VO2 max < 25th, ≥ 25th and < 75th and ≥ 75th percentile for their age and sex as having low, fair to good, and superior to excellent cardiorespiratory fitness, respectively. Classifying individuals by percentiles instead of absolute values allows for comparison between individuals of different ages and sex.
Participants were also grouped as lean, overweight, and obese according to categories of BMI: < 25 kg/m2, between ≥ 25 and < 30 kg/m2, and ≥ 30 kg/m2, respectively. Dyslipidemia was defined as physician-diagnosed dyslipidemia or LDL ≥ 140 mg/dL, or HDL-C if < 40 mg/dL and male or < 50 mg/dL and female or total cholesterol ≥ 240 mg/dL, or triglyceride ≥ 200 mg/dL. Elevated glucose ≥ 100 mg/dL. Hypertension was defined as physician-diagnosed or resting blood pressure ≥ 140/90 mmHg. In this group of participants, physician-diagnosed comorbidities were dyslipidemia, hypertension, non-alcoholic liver disease, and diabetes. Participants were grouped as those with 0, 1, 2, or ≥ 3 comorbidities. Because the number of participants with non-alcoholic hepatic steatosis and diabetes was less than 1% of the total participants, we further grouped participants as hypertension, dyslipidemia, hypertension and dyslipidemia, or neither.
Participants were further classified in the high risk of cardiovascular and metabolic disease group if they had at least 3 of the following: BMI ≥ 25 kg/m2 or elevated LDL ≥ 160 mg/dL or low HDL-C if < 40 mg/dL and male or < 50 mg/dL and female or glucose ≥ 100 mg/dL or triglyceride ≥ 150 mg/dL or physician-diagnosed dyslipidemia or hypertension or blood pressure ≥ 130/85 mmHg. These risk factors categories were a combination of risk factors based on the 2018 American College of Cardiology (ACC)/ American Heart Association (AHA) Guideline on the Treatment of Blood Cholesterol to Reduce Atherosclerotic Cardiovascular Risk in Adults for individuals between 40-75 years of age, without diabetes and with risk enhancing factors (metabolic syndrome) [20].
GENMOD was used to calculate relative risks of being in the high-risk group for cardiovascular and metabolic diseases adjusted for smoking in those with low cardiorespiratory fitness compared to those with cardiorespiratory fitness from fair to superior. This model is not adjusted for age and sex, as the percentiles for cardiorespiratory fitness are based on age and sex. In addition, the model does not include race or ethnicity as this cohort is composed of 94% white individuals. Also, 21% and 17% of participants chose not to answer the question regarding ethnicity or race, respectively. Furthermore, cardiovascular factors and not genetic differences explain variations in VO2 max between whites and African-Americans [21]. A p-value < 0.05 was used to determine statistical significance. All statistical analyses were performed using SAS version 9.4, Copyright I 2016 by SAS Institute Inc., Cary, NC, USA.
RESULTS
Demographics
This group of participants was represented predominantly by middle-aged, white men with blood pressure values near-optimal range and BMI in the overweight category (See Table 1). The median (IQ range) for age was 48.9 (42.2 - 56.2) years, with 5% of participants between 22 and 36 and the top 5% between 63-75 years. The distribution by categories of BMI was lean 45.2%, overweight 38.7%, and obese 16.1%. The comorbidities observed in this group were dyslipidemia (26.6%), hypertension (10%), non-alcoholic hepatic steatosis (1.5%), and diabetes (1.5%). Overall, 55 (27.5%) participants were in the high-risk category for cardiovascular and metabolic diseases.
Differences by Cardiorespiratory Fitness Categories
The overall mean VO2 max for the group was 35.8 mL/kg/min. When divided by percentiles according to age and sex, the mean VO2 max (range) values for those in the low, fair to good, and excellent to superior cardiorespiratory fitness groups were 28 (19.4 - 36.1), 36.8 (27.6 - 46.1), and 45.6 (31.8 - 61.2) mL/kg/min, respectively. Those in the low, fair to good, and excellent to superior cardiorespiratory fitness represented 33%, 46.5%, and 20.5% of all participants, respectively. Cardiorespiratory fitness in mL/kg/min was greater in the 22-42 and 43-55 age group when compared to those older than 56 years, with a mean (SD) of 38.7 (7.3), 36.8 (7.8) vs. 30.8 (6.5) respectively, p < 0.0001 (Figure 1). There was no difference in mean age (SD) 51.0 (1.2), 49.0 (1.0), and 48.5 (1.5) years between those in the low, fair to good, and excellent to superior cardiorespiratory fitness groups, respectively, p ≥ 0.19. Mean BMI (Figure 2) and plasma glucose levels were higher among individuals in the low cardiorespiratory fitness category than those with fair to good and excellent to superior cardiorespiratory fitness. Systolic blood pressure was lower in those with fair to good cardiorespiratory fitness than in those with low cardiorespiratory fitness. However, after statistically adjusting for BMI, neither plasma glucose nor systolic blood pressure differed by categories of cardiorespiratory fitness. Cardiorespiratory fitness was not associated with diastolic blood pressure, LDL-C, HDL-C, or triglycerides in this group of participants.
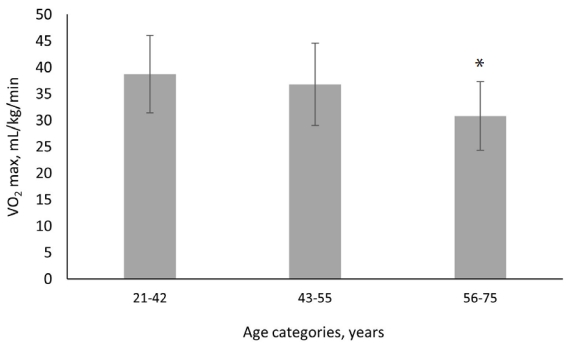
Cardiorespiratory fitness in VO2 max by age category
Values are mean (SD). * indicates p values < 0.001 compared to age categories 21-42 and 43-55 years.

Body mass index (BMI) values by categories of cardiorespiratory fitness
Values are mean (SD). * indicate p < 0.001 compared to those with low cardiorespiratory fitness.
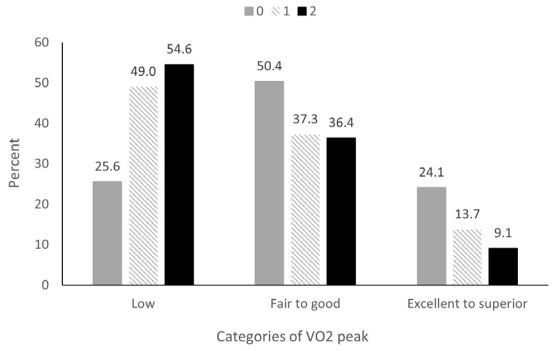
Physician-diagnosed dyslipidemia combined with hypertension was observed in 54.6%, 36.4%, and 9.1% of participants with low, fair to good, and excellent to superior cardiorespiratory fitness, respectively, Chi-Square, p-value = 0.02 (Figure 3).
Plasma Glucose, Lipids, VO2 max, and Comorbidities by Categories of BMI
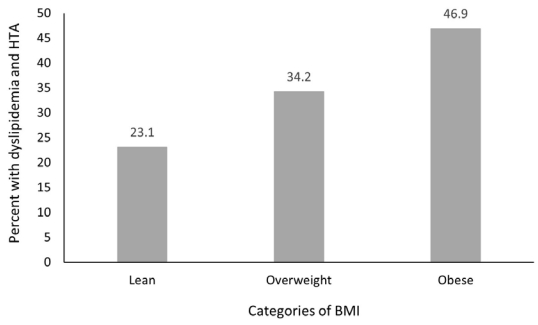
Obese individuals had lower VO2 max [30.6 (1.4) vs 37.3 (0.8) mL/kg/min] (Figure 4A), lower HDL-C [47.5 (8.7) vs. 67.5 (19.2) mg/dL] (Figure 4B) and higher plasma glucose values [102 (12.3) vs. 91 (7.9) mg/dL] (Figure 4C) than lean individuals, respectively. Fair to good categories of cardiorespiratory fitness was observed in 49.5%, 39.8%, and 10.8% of lean, overweight, and obese individuals, respectively, Chi-Square < 0.01, and none of the obese individuals were in the excellent to superior category of cardiorespiratory fitness (Figure 4D). Dyslipidemia and/or hypertension were observed in 31% of participants. The presence of either of these two comorbidities was less prevalent in lean individuals (23.1%), increasing to 34.2% and 46.9% in the overweight and the obese categories, respectively, Chi-Square = 0.01 (Figure 5).
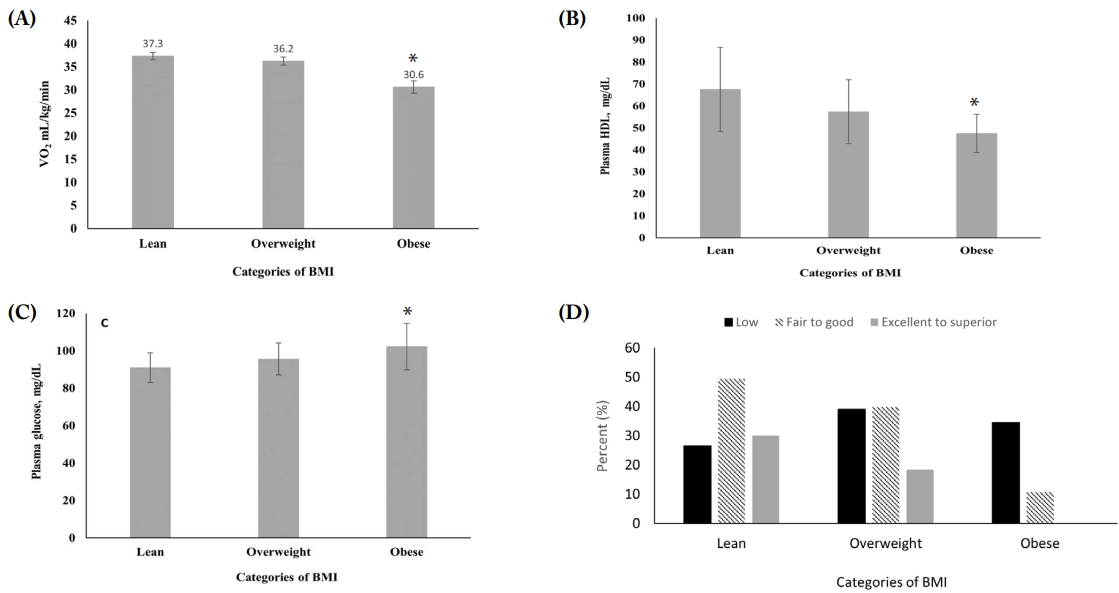
Values of VO2 max (A), HDL-C (B) and plasma glucose (C), and percent of individuals with low and moderate to high VO2 max (D) by categories of BMI
Categories of BMI lean, overweight and obese = BMI < 25, between ≥25 and <30 and ≥ 30 kg/m2, respectively. Plasma glucose and HDL-C values are mean (SD). * Indicates p < 0.001 compared to lean
Risk of Cardiovascular and Metabolic Disease
A higher percentage of individuals with low cardiorespiratory fitness were in the high-risk category for cardiovascular and metabolic diseases than those with fair to good and excellent to superior cardiorespiratory fitness, 42.2%, 24.7%, and 9.8%, Chi-Square p = 0.001 (Figure 6). Those with low cardiorespiratory fitness had a four-fold relative risk of being in the high-risk category for cardiovascular and metabolic disease than those in the fair to superior cardiorespiratory fitness category, unadjusted and adjusted models, p = 0.02, (See Table 2). Including race and ethnicity in the model gave a relative risk (95% CI) of 3.17 (0.95, 10.6), p = 0.06.
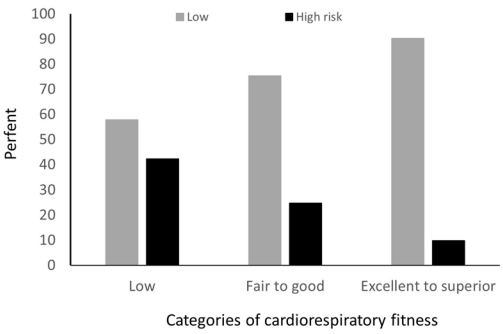
Percent of individuals in the high and low-risk categories of cardiovascular and metabolic disease by categories of VO2 max
High risk = at least 3 of the following: elevated LDL ≥ 140 mg/dL, or total cholesterol ≥ 240 mg/dL, or glucose ≥ 126 mg/dL, or triglyceride 200 mg/dL, or BMI ≥ 25 kg/m2, or physician diagnosed dyslipidemia or hypertension or systolic/diastolic blood pressure ≥ 140/90 mmHg
DISCUSSION
We have identified that a third of all participants in an executive health program had a VO2 max below the 25th percentile for their age and sex (i.e., low cardiorespiratory fitness). Participants in the low cardiorespiratory fitness category were more likely to be obese and have dyslipidemia and/or hypertension than those with fair to superior cardiorespiratory fitness. Furthermore, those with low cardiorespiratory fitness were four-fold more likely to be in the high-risk category for cardiovascular and metabolic diseases than those with fair to superior cardiorespiratory fitness. Interestingly, the percentage of participants who were obese is less than the proportion of obese individuals in the general population of the United States [22]. This study was able to identify a group of individuals who should be specifically targeted to offer personalized strategies to improve cardiorespiratory fitness to decrease their risk of cardiovascular and metabolic diseases.
Cross-sectional associations between cardiorespiratory fitness and cardiovascular and metabolic variables were reported using data from the National Health and Nutrition Examination Survey (NHANES) between 1999-2002 [23]. This group reported that 13.9% of adults (approximately 8.5 million US adults) had low cardiorespiratory fitness, defined as an estimated VO2 max below the 20th percentile for age and sex, according to the Aerobic Center Longitudinal Study. Similar to our results, this study also found associations between low cardiorespiratory fitness and the odds of parameters related to metabolic syndrome. The lower prevalence of low cardiorespiratory fitness in the study by Carnethon et al. [23] when compared to ours, is the stricter definition that they used to classify individuals with low cardiorespiratory fitness. In addition, our population was composed of older individuals who performed sedentary jobs. In contrast, the NHANES cohort represents the general population of the United States.
The low prevalence of obesity in this group of participants is clinically encouraging as obesity is an independent risk factor for cardiovascular disease, diabetes, cancer, osteoarthrosis, and all-cause mortality [24]. However, as the risks of cardiovascular disease and all-cause mortality associated with obesity are modified by cardiorespiratory fitness [25], being in the lean category should be evaluated in the context of the level of VO2 max. Blair et al. published the first report showing that obese fit individuals had a similar risk for CVD mortality as lean unfit individuals, thus suggesting that cardiorespiratory fitness was more important than BMI to predict CVD and all-cause mortality [26]. This initial report has been corroborated in a meta-analysis and review article showing that the association between cardiorespiratory fitness and cardiovascular mortality is independent of BMI [27]. In this study, 20% of lean individuals were in the low cardiorespiratory fitness category. Thus, by BMI standards, these individuals were in the low-risk category for cardiovascular and metabolic diseases but in the high-risk category when classified by cardiorespiratory fitness.
One important reason for improving cardiorespiratory fitness is to build reserve capacity between the VO2 required for activities of daily living and VO2 max. Activities of daily living required a VO2 between 14-17 mL/kg/min [28]. When participants with low cardiorespiratory fitness incurred in activities of daily living, they worked at a VO2 that was between 47% to 87.6% of their maximal cardiorespiratory capacity, meaning that for some, even activities of daily living represented high-intensity activities. Furthermore, as VO2 max decreases by about 10% per decade [29], a point can be reached during the aging process when an individual VO2 max falls below the level required for activities of daily living and can render an individual incapable of living independently.
Although the HERITAGE Family study estimated that VO2 max is up to 50% genetic [30], interventions to increase cardiorespiratory fitness through exercise training programs can induce an average increase in VO2 max between 15.9%- 20.3% in previously sedentary adults [7]. Similarly, a 24 % increase in cardiorespiratory fitness was reported among a group of previously sedentary older men and women who participated in a 9-12 month endurance exercise training program [31]. Furthermore, a meta-analysis of workplace physical activity interventions showed participants in corporate exercise programs obtained a mean effect size in cardiorespiratory fitness corresponding to an increase in VO2 max of 3.5 mL/kg /min [32]. In our study, this would have resulted in a 9.8% increase in VO2 max. In addition, this study found that increases in cardiorespiratory capacity were accompanied by decreases in plasma lipids, glucose, and BMI [32], supporting the beneficial role of corporate wellness programs on cardiorespiratory fitness, glucose, lipid metabolism, and body weight.
As low cardiorespiratory fitness is a modifiable risk factor for cardiovascular and metabolic diseases, wellness programs should include VO2 max assessment as part of their standard clinical practice [33]. Measurement of VO2 max should also be accompanied by submaximal cardiorespiratory parameters such as ventilatory threshold (VT), heart rate, and rate of perceived exertion (RPE) at VT. In sedentary individuals, VT is at the VO2 required for activities of daily living, ~17 mL/kg/min, the VO2 at which they perform most of their physical activities [34]. Therefore, measuring and recording VT provides a quantifiable variable that identifies whether an individual is sedentary or endurance trained. As cardiorespiratory fitness is a modifiable risk factor, corporate wellness programs should incorporate efficient strategies to increase adherence and obtain the long-term cardiovascular and metabolic benefits of exercise training programs.
A major strength of this study is that all data was gathered following the same standardized protocol from the program's start. The main limitation of this analysis is its observational design, small sample size, subtotal participation, and selection bias, as some individuals opted out of exercise testing. Nevertheless, as program volumes grow, we anticipate accumulating longitudinal data that will include percent body fat and free fat mass and submaximal exercise parameters.
CONCLUSIONS
Low cardiorespiratory fitness is a modifiable risk factor present in about one-third of participants attending this executive wellness program. Low cardiorespiratory fitness increases the risk of hypertension, dyslipidemia, obesity, and elevated plasma glucose values. Therefore, as a modifiable risk factor, efforts should be made to develop effective strategies to improve cardiorespiratory fitness through supervised exercise among individuals with low cardiorespiratory fitness.
Acknowledgements
Research reported in this publication was supported by the National Center for Advancing Translational Sciences of the National Institutes of Health Award Number UL1- TR002494. The content is solely the responsibility of the authors and does not necessarily represent the official views of the National Institutes of Health. Special thanks to Nicole Duginski, Executive Health Program Coordinator, MHealth Fairview, Executive Health Clinic.
Notes
Conflict of Interest
The authors declare no conflict of interest.


