Impact of Daily Exercise Compared to Exercise on Alternating Days on Post-Exercise Blood Pressure Reduction in Men with Elevated Blood Pressure
Article information
Abstract
Objectives
Acute exercise can result in post-exercise hypotension (PEH) lasting up to 24-h. Whether exercise performed on consecutive days would lead to an accumulating PEH effect has yet to be determined. The purpose of this study was to compare daily exercise (DE) to exercise performed on alternating days (AE) and control (CON) on PEH.
Methods
Sedentary men 18-30 yr with elevated blood pressure (BP) participated in this three-arm randomized cross-over trial. The primary comparison was PEH between three groups (CON, AE, DE) over time (day 1,2,3). Both exercise groups were prescribed the same exercise intensity (70-75%HRmax), and total duration of exercise (90min) on a cycle ergometer. DE performed exercise on three consecutive days (three bouts 30min). AE performed exercise on two alternating days (2 bouts 45min). Following exercise subjects remained in the laboratory for 1-h while BP was taken every 5-min.
Results
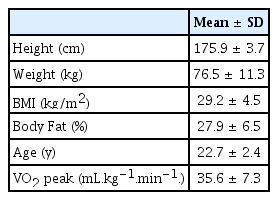
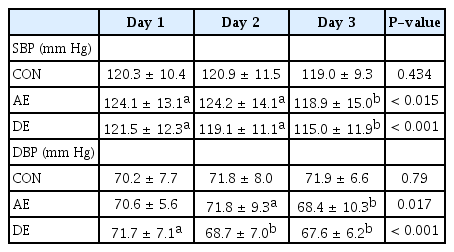
Nine overweight (BMI=29.2±4.5kg/m2), young (22.7±2.4years), moderately fit (VO2peak=35.6±7.3 ml.kg.min), male subjects with elevated BP (126.2±10.4 and 73.3±6.4 mmHg) completed the study. There was a significant systolic BP condition by day effect such that on day three systolic BP (CON 119.0±9.3, AE 118.9±15.0, DE 115.0±11.9 mmHg), and diastolic BP (CON 71.9±6.6, AE 68.4±10.3, DE 67.6±6.2 mmHg) were lowest during the post-exercise DE condition (P<0.001). Additionally, DE saw a significant reduction of resting systolic BP between day 1 and day 4 (122.8±10.2 mmHg vs 113.1±12.0 mmHg; P=0.022, respectively) and a borderline significant reduction between day 1 and day 3 (122.8±10.2 mmHg vs 114.8±10.0 mmHg; P=0.051, respectively). DE saw a borderline significant resting diastolic BP reduction between day 1 and day 3 (73.2±7.2 mmHg vs 68.6±6.5 mmHg; P=0.058, respectively) and a significant reduction between day 1 and day 4 (73.2±7.2 mmHg vs 66.4±4.3 mmHg; P=0.022, respectively).
Conclusions
In conclusion, the post-exercise BP lowering effect of the prior exercise session appeared to accumulate during DE such that day 3 was the lowest of all conditions and days.
INTRODUCTION
According to the World Health Organization, more than a third of the world’s deaths can be attributed to a small number of risk factors. Among the top five leading risk factors are hypertension (HTN), obesity and physical inactivity [1]. Based off the recent blood pressure (BP) guideline changes roughly 46% of Americans are now classified as HTN [2]. Approximately 7.1 million deaths worldwide are attributed to HTN [3], and lifetime risk for developing HTN is estimated at 90% [4].
The recent BP guidelines also emphasized an “at risk” BP classification being titled “elevated Blood Pressure” (Systolic BP (SBP) 120-129 and Diastolic BP (DBP) < 80 mmHg) [2]. Those with elevated BP are the most vulnerable population for developing HTN [5], and are at increased risk for cardiovascular morbidity and mortality [6]. However, the only recommended treatment for those classified in the category of elevated BP is lifestyle modification, including exercise interventions [6].
Exercise training has shown to reduce BP burden [7]. Indeed, even an acute exercise bout can result in post-exercise hypotension (PEH) lasting up to 24-h, measured by 24-h ambulatory BP, displaying the possibility of merging into a following exercise session when conducted daily [8-10]. Thus, acute and chronic exercise BP response cannot be viewed in isolation. Acute post-exercise BP lowering responses may accrue in a cumulative manner so that following subsequent sessions an added post-exercise lowering BP effect may be seen [11]. The BP lowering impact of acute exercise could possibly explain exercise training BP reductions, thus highlighting the significance of the acute exercise response [11-13]. Additionally, prior research has shown an additive effect of consecutive exercise on glycemic control [14] and triglycerides [15]. The current study adds to the body of literature by suggesting that the well-established post-exercise BP reduction may accumulate when daily exercise (DE) is conducted to produce superior BP lowering effects. Additionally, if an accumulation effect is seen, it is unknown if DE is superior to exercise performed on alternating days (AE).
Investigations designed to compare different components of the exercise prescription for those with elevated BP are lacking [16]. It has been suggested that the current recommendation on training frequency should be changed from accumulating 30 min on most, preferably all days of the week, to simply all days of the week [16].
The purpose of this study was to assess the possible additive effects of DE compared to AE on PEH in males with elevated BP. It is hypothesized that when DE is performed an additive effect will be witnessed such that PEH on day 2 and 3 will be greater than the PEH on day 1.
METHODS
Study Design
The present study was a three-arm randomized experimental design. The Grand Canyon Institutional Review Board approved this study (IRB # 948803-2). The primary comparison was the magnitude of PEH between the three groups and within each group over time. Figure 1 gives graphical depiction of the research design. This cross-over experimental trial consisted of subjects randomized into 3 groups: DE, AE, and a non-exercise control (CON). Additionally, after completion of the first condition subjects were randomly assigned to the last two conditions and all subjects completed each condition. A period of one week was used as the washout time, thus, each condition was performed one week apart. Exercise duration between groups were matched at 90 min split into either three 30 min sessions (DE), or two 45 min sessions (AE). Exercise was performed on a cycle ergometer at an intensity of 70-75% heart rate (HR) max. Blood pressure was measured at 5 min intervals for 1 h following each exercise session.

Schematic overview of the experimental period.
Subjects completed each condition, non exercise (CON), 90 min of cycling at 75% of HR max distributed as two 45 min sessions on alternating days (AE), and three 30 min sessions performed daily (DE). Following exercise, or rest during CON, subjects remained in the lab for 60 min. During the post-exercise period, subjects’ BP was measured every 5 min.
Participants and Settings
a. Inclusion Criteria
Nine, sedentary (not meeting physical activity guidelines of 150 min/week determined by the International Physical Activity Questionnaire [17], men aged 18-30 yr with elevated BP (SBP 120-129 mmHg AND DBP <80 mmHg) were recruited to participate in this experimental trial.
b. Exclusion Criteria
Having known cardiovascular, pulmonary, renal or metabolic disease, and current smokers, were excluded from the study. In addition, those who are morbidly obese (BMI >40 kg/m2) or had HTN (SBP >140 mm Hg or DBP >90 mm Hg) were excluded. Subjects were also excluded if they were taking oral anti-histamine medications as it is known that the histaminergic pathways are responsible for much of the PEH response [18].
c. Consent Process
The informed consent was given to potential participants and adequate time was allowed for them to read over it. Once the potential participant was finished reading the informed consent, the investigator gave the individual an opportunity to ask any questions.
BP Screening and Baseline Measurements
For all participants, three BP measurements were taken on two separate occasions 3 d apart according to the protocol described by the World Health Organization [3]. On the first day BP was taken in both arms. The arm with the highest BP was used for screening on the second day. Six total measurements were averaged together and used for determining if subjects met the elevated BP criteria. Blood pressure was measured via the digital BP device (Connex® ProBP™ 3400, Welch Allyn, USA).
Once subjects met the inclusion criteria, baseline measurements were assessed. Blood pressure was first assessed in a seated resting condition in the laboratory before the first study day. Following BP measurement body composition was measured and then a VO2peak test was performed (see below for procedures).
a. Body Composition
Body composition was measured via whole body air displacement plethysmography (Bod Pod). Subjects were asked to wear a bathing suit or tight-fitting shorts and to remove their shirt for testing and remove all jewelry. Subjects were first weighed on a scale in bare feet. Subjects were then asked to place a cap on their head to cover their hair. Subjects then sat in the Bod Pod for 2-3 measurements of 50 sec each. Following the Bod Pod the VO2peak test was conducted.
b. VO2peak
This test was a ramp cycle ergometer protocol. Subjects began on the cycle ergometer at 25 watts for 5 min for a warmup. Every min the wattage increased by 20 watts until the subject reached volitional failure or requested to stop. Subjects were given a 5 min cool down period on the ergometer at 25 watts. Oxygen consumption was analyzed continuously by the Vmax metabolic cart (CareFusion, Franklin Lakes, NJ) and averaged every 10 seconds. VO2peak was determined as the 2 highest consecutive 10-second oxygen consumption values.
Measurement Procedures
Subjects were asked to consume the same foods over the 4-d measurement period of each condition and a dietary food log was given to aid in this endeavor. Subjects were instructed to refrain from any physical activity for 72-h prior to initiating the study. Baseline measurements were assessed prior to any experimental visits. Laboratory visits were conducted at approximately 1230 h because of the superior effect that afternoon exercise has compared to morning exercise on PEH [19]. When subjects arrived at the laboratory they were asked to sit quietly for 20-min. Two BP readings were taken to ensure hemodynamic stability. Following this verification of hemodynamic stability, two additional BP readings were then taken and averaged together to give a “pre-exercise” BP value. After the completion of exercise or a non-exercise CON, subjects were asked to remain in the laboratory for 1-h while laboratory BP was taken every 5-min for a total of 12 post exercise BP measurements. During CON, subjects remained in the laboratory for roughly 1.5 h while resting BP and the “post-exercise” measurements were taken. All BP measurements were made while the subjects were sitting in an upright position.
Exercise Protocol
Exercise during both DE and AE were prescribed the same intensity (70-75% of measured HR max), and total duration of exercise (90 min). Exercise was performed on a cycle ergometer. The only difference between the two exercise conditions was that during DE, exercise was conducted on three consecutive days (three bouts of 30 min) compared to during AE where exercise was conducted on two alternating days (2 bouts of 45 min). Subjects were required to perform exercise in the laboratory under supervision of one of the researchers. To ensure exercise intensity adherence, HR monitors were worn by the subjects and researchers monitored HR every 5 min during the exercise sessions.
Statistical Analysis
Data were analyzed using SPSS software (version 24). The alpha error for the primary end point was set at 0.05 and the beta error level at 0.2. Data are expressed as mean ± standard deviation (SD). All P values were calculated assuming two-tailed hypothesis; P < 0.05 was considered statistically significant. Data were analyzed for normality and transformed if necessary. Descriptive statistics were used for the demographics of the subjects. Resting BP within group (CON, DE, AE) over time (Day 1, Day 2, Day 3, Day 4) and between group over time was analyzed using Linear Mixed Models (LMM) to detect differences in systolic and diastolic BP. PEH was analyzed by the average of the 12 post-exercise BP values, or in case of the CON condition it was following rest, was compared within group (CON, DE, AE) over time (Day 1, Day 2, Day 3). This comparison was used to assess a possible accumulating impact of DE. Overall effect was compared using LMM. Additionally, the pre-exercise resting BP values were compared to the post exercise BP values of the same day via LMM to assess the impact of pre-exercise BP on same day PEH. LMM was conducted in a hierarchical fashion using Restricted Maximum Likelihood model and ‘variance components’ covariance error structure. Both fixed and random effects were explored in the model. Sample size was calculated using a 2-sided hypothesis α= 0.05 and β= 0.20 based on previous work provided effect size estimates [10]. In response to an acute bout of aerobic exercise using within subjects differences, BP has shown to be reduced following exercise at a magnitude of 3/2 mmHg with a SD of ± 1 mmHg [10] when compared to a non-exercise control period covering the same time span and within the same subject. Eight total subjects were needed to properly power the current study.
RESULTS
Nine subjects completed each stage of the study. Table 1 presents demographic characteristics of the subjects. Briefly, subjects were relatively young, overweight, and on the lower end of the fitness spectrum for their age [20].
Resting BP Changes
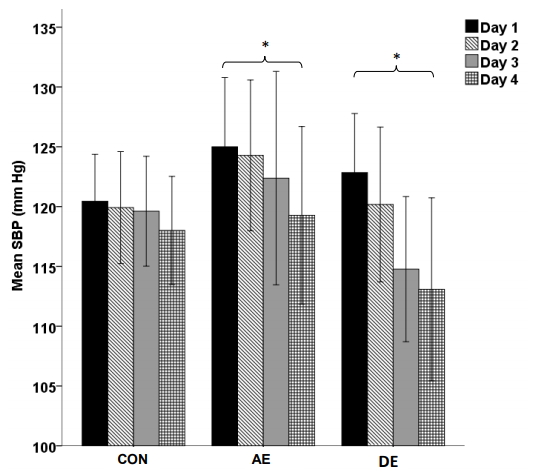
Resting pre-exercise BP values between days 1 and days 3, in addition to resting BP on day 4 were compared to assess the impact of exercise the day before on resting BP. Figure 2 (SBP) and Figure 3 (DBP) illustrate there were no significant differences in resting SBP (P = 0.874) or DBP (P = 0.459) for CON over days 1 through 4. There was a non-significant trend for AE to produce decreased resting SBP between days 1 through 3 (P = 0.079). However, there was a significant reduction of resting SBP between day 1 and day 4 during AE (125.0 ± 11.3 mm Hg vs 119.3 ± 13.4 mm Hg; P = 0.016, respectively). Resting DBP during AE only significantly reduced between days 1 and 4 (70.2 ± 6.4 mm Hg vs 64.5 ± 8.6 mm Hg; P < 0.001, respectively). DE saw a significant reduction of resting SBP between day 1 and day 4 (122.8 ± 10.2 mm Hg vs 113.1 ± 12.0 mmHg; P = 0.022, respectively) and a borderline significant reduction between day 1 and day 3 (122.8 ± 10.2 mmHg vs 114.8 ± 10.0 mmHg; P = 0.051, respectively). DE saw a borderline significant resting DBP reduction between day 1 and day 3 (73.2 ± 7.2 mmHg vs 68.6 ± 6.5 mmHg; P = 0.058, respectively) and a significant reduction between day 1 and day 4 (73.2 ± 7.2 mmHg vs 66.4 ± 4.3 mmHg; P = 0.022, respectively).
Post exercise BP compared to Day 1
Post-exercise BP was compared within condition over time with the primary comparison being days 2 and 3 compared to day 1. This allowed for the assessment of a possible accumulation effect. Table 2 shows average post-exercise BP (average of the 12 post-exercise, or post rest during CON, measurements) values for each condition (CON, DE, AE) over time (days 1, day 2, day 3). There was no significant post-exercise BP difference for CON over the 3-day measurement period for either SBP (P = 0.434) or DBP (P = 0.790). There was no significant SBP post-exercise BP difference between days 1 and 2 during AE. Days 1 and 2 did however significantly differ from day 3 during AE (P = 0.015). Day 3 during AE was the lowest for DBP (P = 0.017). During DE, day 3 was the lowest post-exercise BP and was significantly lower than days 1 and 2 (P < 0.001). Both days 2 and 3 were significantly lower than day 1 during DE for DBP (P < 0.001).
PEH compared to Pre-exercise Resting BP
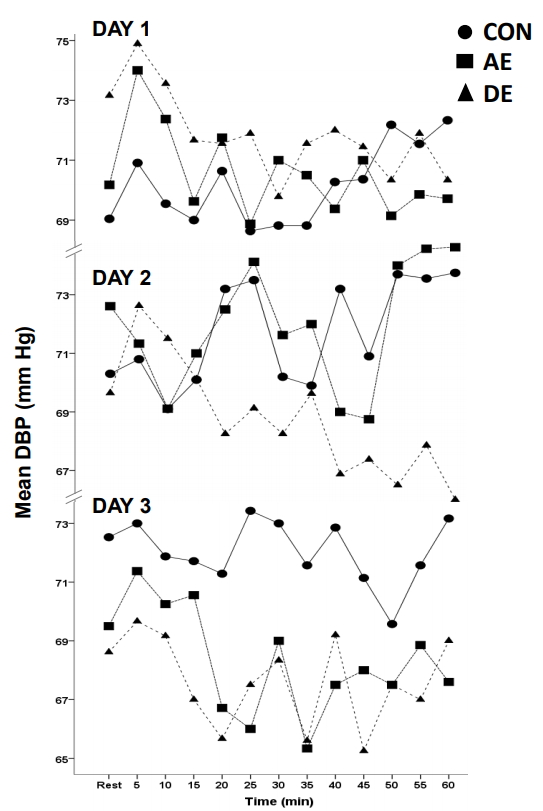
Post-exercise hypotension was compared between the pre-exercise resting BP values and the average post-exercise values of the same day. Figure 4 (SBP) and Figure 5 (DBP) show PEH compared to pre-exercise BP values within group over time. The CON saw no post-exercise SBP or DBP reductions on day 1, day 2 or day 3 (all P > 0.05). AE saw no post-exercise SBP or DBP reduction on day 1 (P = 0.534, P = 0.518, respectively) or day 2 (P = 0.656, P = 0.517, respectively). AE saw a significant SBP reduction following exercise on day 3 (-5.3 ± 5.4 mm Hg, P = 0.004) with no significant change in DBP (P = 0.247). There was not a significant DBP reduction following exercise during AE on day 3 (P = 0.247). DE on day 1, day 2, and day 3 did not cause a reduced SBP or DBP following exercise (all P < 0.05).
DISCUSSION
In summary, our data showed that resting SBP and DBP was the lowest on day 4 of the DE condition. Additionally, the average SBP PEH values were the lowest following exercise on day 3 for the DE condition. In fact, the only condition in which post-exercise SBP was significantly lower than the CON condition was day 3 during DE. Taken together this suggests that the impact of exercise on the day or days prior indeed did accumulate to produce a pronounced BP lowering effect.
Our hypothesis was formulated based on prior research showing an additive effect of consecutive exercise on glycemic control [14] and triglycerides [15]. Additionally, it has been shown that PEH may last for 24-h [8,9,21], displaying the possibility of merging into a following exercise session when conducted daily. The current study adds to the body of literature by suggesting that the acute BP lowering impact may accumulate when DE is conducted to produce superior BP lowering effects.
Prior research examining impact of DE on BP had limitations. Nelson et al evaluated the effects of exercise frequency on BP and found that the decrease in BP in HTN subjects was significantly greater on a seven- as opposed to three-times per week exercise program. However, because the total amount of exercise was 135 min/wk and 315 min/wk in the three and seven times per week group, respectively, the effects of exercise duration could not be isolated from frequency. Other training studies have attempted to answer the question of the necessity of DE but did not assess the acute BP lowering affect [22,23]. The current study matched exercise intensity and duration between exercise performed on three consecutive days and exercise on two alternating days allowing for the direct assessment of the impact of DE on PEH and resting BP outcomes.
The current study also found that post-exercise SBP and DBP for AE was lower on day 3 (exercise did not occur on day 2) when compared to day 1. This suggests that the BP lowering impact of exercise on day 1 persisted for 48 h. This adds to the theory that chronic exercise training effects on BP may merely reflect the acute PEH phenomenon with sustained BP reductions accumulating from each bout of exercise [24]. Indeed the magnitude of PEH to an acute bout is a strong predictor of how well one may respond to a chronic exercise training program [25-27]. In fact, when analyzed separately it has been shown that there is no difference in magnitude of BP (24-h ambulatory BP) reduction between the acute and chronic response from exercise [21,28].
It is not readily apparent as to why BP during DE was not lower following exercise on days 1 and 2 when compared to CON. It could be that our exercise intensity was not high enough to illicit a response. Although controversial, recent data on exercise intensity and PEH has suggested that the higher intensity the exercise the greater the magnitude of BP reduction [29]. Our study also found that the longer duration of the AE sessions did not provoke greater PEH or greater resting BP reductions when compared to the shorter DE condition. This supports previous work that suggests PEH is a low threshold phenomenon in terms of the duration of exercise needed [30]. This is relevant when considering that time is one of the biggest deterrents of exercise engagement.
Only post-exercise SBP on day 3 during AE was lower than pre-exercise resting values. It has been determined that one of the biggest predictors of PEH is resting pre-exercise values [31]. Resting SBP pre-exercise value on day 3 was significantly lower during DE when compared to AE. This resting SBP difference more than likely explains why DE during day 3 did not lower SBP when compared to the pre-exercise SBP value. In fact, it appeared that the lowering of the pre-exercise BP value negated almost all the PEH impact that was expected to be seen. This study adds to the literature by providing further support that pre-exercise BP values are a predictor of the magnitude of the PEH effect.
Our study has its limitations. First, our population was relatively young, healthy, and active. Divergent results may be seen in diseased or older populations. Also, subjects were free to eat on their own and eat what they liked. Subjects were asked to eat the same thing before coming to the lab and between conditions and a dietary recall was given to aid in this endeavor. Additionally, the post-exercise duration was only for one hour, thus minimizing generalizability. This time frame was chosen however due to past data suggesting the lowest post-exercise BP value takes place within the first hour [32,33] and because of prior data suggesting that this immediate reduction could possible predict training responses [25-27]. Exercise duration for a single exercise session was not matched. However, BP lowered in response to the shorter DE to a greater degree than the longer AE session. Suggesting that even if the longer durations could be superior, the magnitude was not great enough to overpower the importance of back to back exercise sessions. Additionally, outside physical activity was not closely monitored. However, subjects were asked to not engage in any outside activity above what was prescribed by the researchers. Lastly, only males were recruited for this study. However, men were chosen due to the lack of research within this population and due to possible menstrual effects on the vasculature. Additionally, data suggests sex is not a major player in the post exercise BP response [34].
There are many strengths to our study. Our cross-over study design increases intra-subject control and decreases bias. We also made sure to time match the different conditions to control for diurnal variations. A flaw in PEH research is seen when the primary comparison is resting pre-exercise values to post exercise values of the same day. BP changes on a diurnal basis and this diurnal change could explain the PEH effect opposed to the previous exercise activity. Thus, we compared PEH between a time matched control in addition to pre-exercise values. We also used the public exercise guidelines of moderate intensity exercise in 30 min bouts. Lastly, we matched total exercise duration for each condition to better isolate the impact of exercise frequency.
It should be noted that upwards of 25% of people with the goal of lowering BP in response to exercise have been classified as “non-responders” [35]. The current study showed that post-exercise BP did not reach statistical significant reductions until day 3 when compared to CON. Those classified as “non-responders” may have not yet been exposed to enough of an exercise dose. This should be taken under consideration when labeling subjects as “non-responders”.
From a clinical standpoint, the BP reductions seen in the current study are not negligible. Indeed reductions of just 5 mmHg of systolic BP in the population would result in a 14% overall reduction in mortality due to stroke, a 9% reduction in mortality due to CHD, and a 7% decrease in all-cause mortality [36].
CONCLUSIONS
In conclusion, DE appeared to cause a BP lowering accumulating impact such that BP was the lowest after exercise was conducted three days in a row. The results of this study should be used to tailor future research using training protocols designed to test ideal exercise frequency to lower BP.
Acknowledgements
The authors would like to thank the participants and the undergraduate students who helped in data collection for this work.
Notes
Conflicts of interest
The authors declare no conflict of interest.


