Effect of Eight Week's Dryland Strength Training on Adolescent Backstroke and Freestyle Performance: A Randomized Controlled Trial
Article information

Abstract
OBJECTIVES
Swimmers undertake dryland training to improve power and maximise propulsion. Our purpose was to improve strength and quantify transfer to adolescent sprint backstroke and freestyle performances.
METHODS
Twenty-eight male competitive swimmers participated (age: 12.6±2.6 years; height 156.4±13.4 cm; mass 49.8±15.0 Kg; 50 m freestyle best time 45.0±8.5 s) and were randomized to either dryland strength plus swimming (DS) or a swimming only control group (CONT). The 8 week dryland programme (3 days/week) consisted of 8–10 exercises per session (22 exercises in total) with predominantly 1–2 sets of ~10–20 repetitions. Pre, mid and post 8 weeks training, a strength test battery (countermovement jump, pronated chin ups, isometric forearm and back extension) and 25 m pool testing of backstroke and freestyle was undertaken.
RESULTS
DS had greater strength improvements across the test battery (13–167%; ES, 0.51–1.84) than CONT (8-120%; ES, 0.35–2.0) with p<0.05 for 6 of 8 measures. For 50 and 100 m freestyle, DS had greater percentage improvement (DS, 4.8±1.6 and 3.7±1.6%, ES, 0.20 and 0.16; CONT, 2.7±0.9 and 1.6±0.8%, ES, 0.16 and 0.13, p<0.01). There was no between group statistically significant change in backstroke percentage improvement, however both groups displayed small magnitudes of improvements in 50 m and trivial improvements over the 100 m distance (DS, 4.4±2.3 and 1.6±0.5%, ES, 0.29 and 0.08; CONT, 3.6±2.5 and 1.3±0.5%, ES, 0.26, 0.08).
CONCLUSIONS
Over 8 weeks, adding 90 min dryland training / week to ~7 hour/week swim schedule further improved freestyle ~2.1% and backstroke ~0.5% more than swim training alone.
INTRODUCTION
Dryland training forms an integral part of a swimmer’s arsenal of training methods to improve muscular strength and power. Dryland strength studies commonly show positive associations between strength development and swimming performance, yet the authors of a recent review conclude “efficacy of dryland strength training interventions remains unclear” [1]. The transfer of muscular strength and power from complementary training methods outside the pool aids not only the body’s propulsion through water but also other components of swimming [1]. A swimming race is traditionally divided into four key components; start, surface swim, turns and the finish [2]. The speed of the surface swim component has been recognized as the most important determinant of overall performance and accounts for up to 50% of the overall race time during a 50m race [3]. The relative importance of other components changes depending on the length of pool, with longer 50m pools (defined as racing ‘long course’) having less turns than events in 25m pools (defining as racing ‘short course’). Nevertheless, having good explosive strength is critical to executing a fast start off the blocks, and quick turns.
Strength training in adolescents is effective in reducing skinfold thickness, while improving strength, body composition, motor skills and flexibility [4]. Neuromuscular adaptations that occur within the prepubescent period have been identified as the main mechanism for strength improvements [5,6]. Some coaches erroneously fear that greater hypertrophy with reduced flexibility may compromise an adolescent swimmer’s performance through increased resistive drag forces [7]. Despite correlational studies showing benefits of dryland strength training for swimmers [8,9], training studies to date have proved inconclusive [8,10-12]. It may be that dryland exercise selection needs to more closely mimic the actions of the movements involved in the various swimming components, therefore adhering to the well-known training principle of specificity [13].
Limited research has quantified the transfer of strength gains from dryland to in-water performance, especially for adolescent backstroke swimmers. With the myriad of dryland options regarding exercise selection, movement speed, volume, intensity and frequency there is a pertinent need to expand understanding of the effectiveness of different training programmes in ultimately improving swimming performance. Therefore, our first priority is to substantially improve adolescent swimmers’ overall strength by implementing a structured eight-week dryland training program. Then, our objective is to quantify and compare the transfer of dryland strength gains to adolescent backstroke and freestyle swimming performance.
METHODS
Study Participants
Twenty-eight junior Saudi Arabian club swimmers (age: 12.6±2.6 years; height 156±14 cm; mass 49.8±15.0 kg; best 50 m Freestyle time 45.0±8.5 s) volunteered to participate in the study and were randomly assigned to dryland strength training (DS) or swimming only control (CONT) groups (n = 14 per group). The inclusion criteria required participants to be competitively training, proficient in freestyle and backstroke and between 8 and 18 years of age, while any swimmer that was currently injured was excluded from partaking in the study. The distribution of the sample and sample size is explained in the CONSORT flowchart (Figure 1). All swimmers had little or no experience of structured landbased strength training, but regularly trained a minimum of seven hours a week in the pool. All procedures performed were approved by the University’s Human Ethics Committee (approval number HEC2019/17/LR-PS) that conforms to the 2008 Helsinki Declaration for Human Research Ethics. Signed informed consent was obtained from all individuals and their respective guardians. In addition, a familiarization session was held prior to baseline testing.
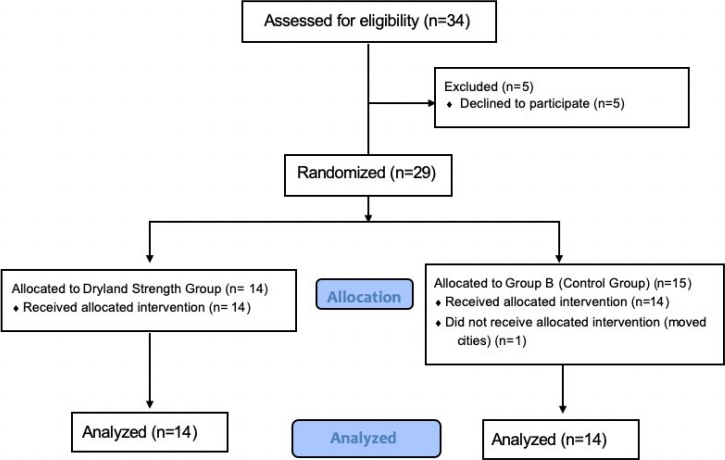
CONSORT diagram
Experimental Design
A randomized controlled trial design was used to assess the impact of adding twenty-four 30 minute dryland strength training sessions on 50 and 100 m freestyle and backstroke short-course (25 m pool length) swimming performance. All participants were familiarized with testing procedures 48 hours prior to baseline testing. Baseline strength and in-water time trial testing was performed a week prior to the commencement of the strength training intervention. Using 50 m backstroke times, swimmers were ranked and pairmatched by the lead investigator and were randomly allocated (coin toss) into dryland strength (DS) or swimming only control (CONT) groups (see Table 1). The prescribed training for the DS group was performed three times per week over the next eight weeks, while both groups maintained their normal swim training. After completing four and eight weeks of dryland training, all swimmers performed mid and post-testing of strength and 50 and 100 m freestyle and backstroke time trials.

Swimmer descriptive data
Strength Testing
Strength testing was undertaken after a standardised 10 minute aerobic warm up which included dynamic stretching. A vertical jump test was employed to measure anaerobic power using a Vertec (Vertec Sports Imports, OH) device. First the swimmer had their standing reach height measured with their heels maintaining contact with the ground. They were then instructed to perform three countermovement jumps for maximal height with their best jump being recorded.
Swimmers then performed three standing broad jumps employing an effective arm swing. Broad jumps were measured using a tape measure from the start line to the nearest point of contact (back of heels), and each swimmer’s largest jump distance was recorded. A pronated grip chin-up test was employed to measure upper body strength with swimmers asked to perform as many repetitions as possible. The swimmers were instructed to pull themselves up from an extended arm position until their chin cleared the wall-mounted horizontal bar, and then lower themselves to the starting position. Swimmers were also instructed that swinging the body or kicking the legs was not permitted.
Resisted isometric forearm strength was measured bilaterally in a supine position on an elevated plinth using a Microfet 3 handheld dynamometer (HHD) (Hoggan Scientific, UT, USA). Swimmers were instructed to perform internal and external rotation against the resisted HHD after they became familiar with isometric contractions. Isometric strength was evaluated with the shoulder abducted 30° and with the elbow flexed at 90°, as described by Donatelli [14]. The HHD was positioned 2 cm from the styloid process of the radius on the dorsal side of the forearm to obtain a resisted external rotator isometric muscle strength measure. Whereas the HHD was positioned 2 cm from the proximal wrist crease on the ventral side of the forearm in order to obtain the internal rotator isometric muscle strength measure. After placing the HHD, swimmers were asked to gradually build up isometric force for five seconds against the device. Each participant performed three attempts and the mean was recorded.
Finally, swimmers had their isometric back extension strength measured using a timed horizontal position test. Swimmers laid in a prone position over the edge of a plinth with their interior superior iliac spines supported on the table edge and their ankles secured [15,16]. Swimmers tried to maintain their horizontal position for as long as possible and timing was stopped when a swimmer dropped below the horizontal plane.
Swim Testing
Swimming backstroke and freestyle time trials were undertaken in an indoor 25m length pool on separate days with 48 hours between those testing sessions. After a standardised 10 minute in-water warm up swimmers were stop-watched timed (Finis 3×100 m stopwatch, Livermore, CA) swimming 50 m by three experienced coaches with the median of the three times taken. After 10 minutes recovery, swimmers performed a maximal 100 m time trial. Immediately post time trial each swimmer’s heart rate was recorded using a heart rate monitor (Polar FS1, Polar, Finland). The swimmer’s rating of perceived exertion (RPE) was also collected at this time using Borg’s (6 – 20) scale [17].
Dryland Strength Training Programme
During the training intervention, the CONT group only completed their scheduled swimming training sessions. Whereas, in addition to swim training, the DS group completed a dryland strength programme, outlined in Table 2. The dryland strength programme lasted for 8 weeks and was carried out an hour prior to regular swim sessions, three times per week (Sunday, Tuesday and Thursday) giving a total of 24 training sessions. Prior to each dryland session the swimmers undertook a 10-minute dynamic warmup.
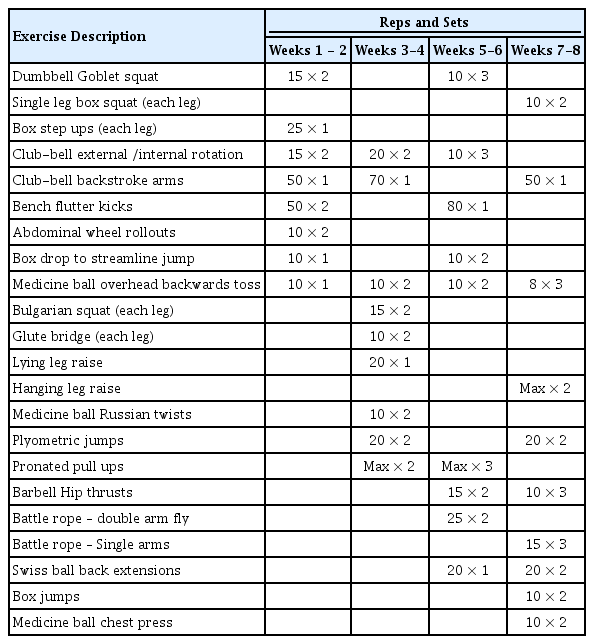
Eight week dryland training program
Statistical Analysis
Descriptive data was analysed (mean ± SD) for all variables. The magnitude and direction of the difference between pre to post testing was calculated using a standardized effect size statistic. Hopkins’ criteria were employed for interpreting effect sizes: <0.2 trivial, 0.2-0.6 small, 0.6-1.2 moderate, 1.2-2.0 large, 2.0-4.0 very large, and 4.0+ extremely large [18]. A one-tailed independent t test was performed between groups on the percentage change scores for all variables.
RESULTS
Over 8 weeks, the DS group had significantly greater percentage strength improvements (p<0.05) in all except the chin up (p=0.052) and left external forearm strength (p=0.06) tests, see Figure 2. From pre to post testing, the DS group had large strength improvements (39–67%; ES, 1.26–1.84) in 6 measures (Vertical jump, isometric strength measures, back extension), with moderate gains in pronated chin ups (167%; ES, 1.0) and a small inprovement in broad jump (13%; ES 0.51), as seen in Table 3.
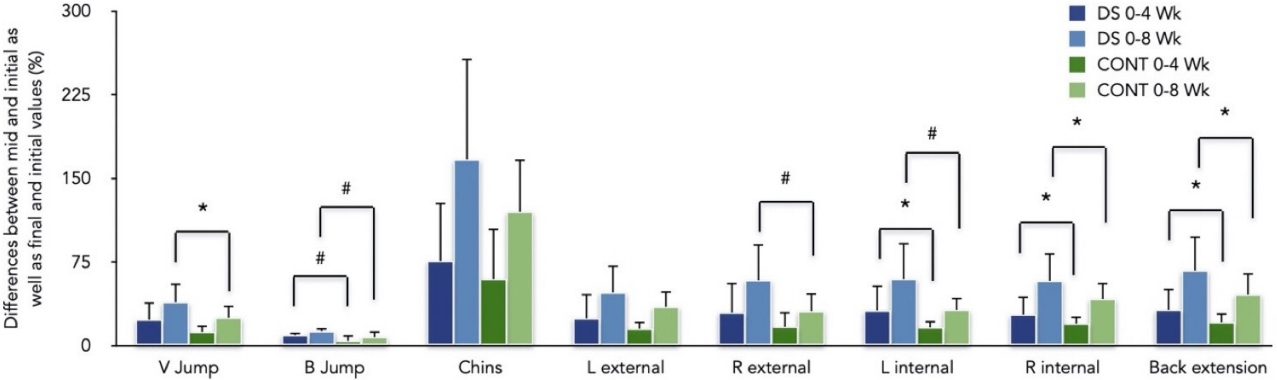
Mean (SD) percentage change of strength values for both groups comparing mid (4 week) to initial, and final (8 week) to initial measurements
*Significantly differenct between groups at the (p<0.05) level of signiificance.
# Significantly differenct at the (p<0.01) level of signiificance.

Dryland strength changes, tested at Week 0, Week 4 and Week 8
For both freestyle and backstroke, both groups demonstrated a diminishing level of improvement as race distance increased, see Figure 3.

Percentage improvement over 8 weeks in swimming percentage.
50m freestyle (A), 100m freestyle (B), 50m backstroke (C), and 100m backstroke (D)
*Significantly differenct between groups at the (p<0.05) level of signiificance.
# Significantly differenct at the (p<0.01) level of signiificance.
Freestyle
The DS group had significantly greater percentage improvements swimming 50 and 100 m freestyle (DS, 4.8 and 3.7%; CONT, 2.7 and 1.6%, p<0.05). Across the entire training period, DS increased stroke rate moderately in both 50 and 100 m Freestyle, whereas CONT only had a small magnitude of increased stroke rate. Comparing between groups there was a large and moderate magnitude of difference in the % change of stroke rate for 50 and 100 m freestyle. Both groups showed reductions in exercising heart rate with greater reductions in the 50 compared to the 100 m freestyle distance, the DS also had a significantly greater % change in heart rate (p<0.05) compared to the CONT equating to a moderate magnitude of difference, whereas there was a small magnitude of difference in heart rate between groups for 100 m freestyle. Both groups had extremely large reductions in RPE from pre to post training, however between groups there was a significant (p<0.05) and moderately greater change for DS group in the 100 m freestyle, see Table 4.
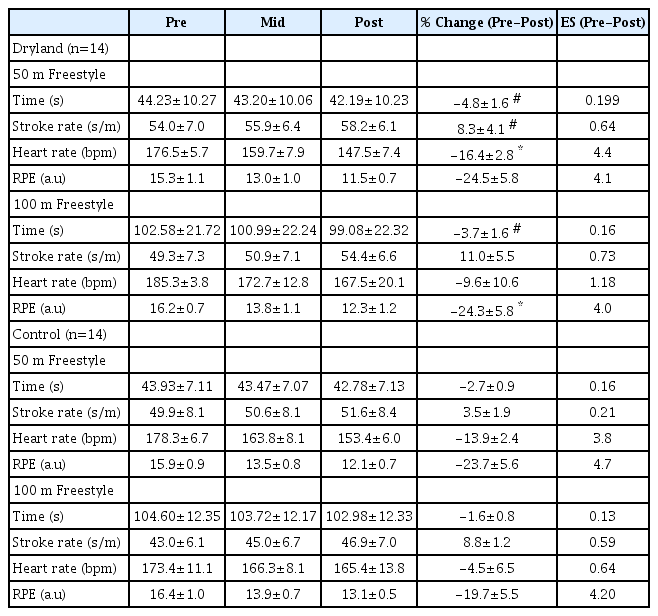
Freestyle swimming changes, tested at Week 0, Week 4 and Week 8
Backstroke
For backstroke, only the 25 m split of the 100 m time trial showed a significantly better percentage improvement for the DS group (p<0.05), see Figure 1. Both groups displayed small pre to post-test magnitudes of improvement in the 50 m backstroke distance, with only trivial improvements overall for the 100 m distance (DS, 4.4 and 1.6%; CONT, 3.6 and 1.3%) see Table 5.

Backstroke swimming changes, tested at Week 0, Week 4 and Week 8
Across the entire training period, the DS had a large increase in stroke rate for the 100 m backstroke but a trivial decrease for the 50 m event. The CONT had moderate increases in stroke rate for the 50 and a small stroke rate increase in the 100 m backstroke. Comparing between groups there was a significant (p<0.05) moderate magnitude of difference for increased stroke rate with the 50 m (greater increase in the CONT) and a significant (P<0.01) large magnitude of difference for the 100 m backstroke (greater increase in the DS). Both groups had moderate or extremely large reductions in exercising heart rate, again with greater reductions in 50 compared to the 100 m distance. The DS had a small magnitude of greater % change in heart rate for the 100 m backstroke compared to CONT. Both groups had extremely large reductions in RPE from pre to post training, while comparing between groups there was a small magnitude of greater reduction for DS group in the 100 m backstroke, see Table 5.
DISCUSSION
The purpose of the present study was to quantify the transfer of dryland strength gains to in-water performance. To achieve this, we first needed to effectively improve strength through our implementation of an eight-week dryland training programme. Our data shows that from pre to post testing the DS group displayed moderate to large strength improvements in all assessed measures. Across all measures the DS group improved strength by an average 63%, this compares to a 42% improvement in the CONT group. Our DS improvement compares favourably with Dahab and McCambridge’s observations of 30–50% strength improvements in children after 8–12 weeks of a well-designed strength training programme [19]. Our improvement is also in the range of observations by Faigenbaum et al., [5] that state typical gains of 30% after short term (8–20 week) interventions should be expected, with the highest reported gains being 74% for youth resistance programmes.
Having successfully improved strength we are able to assess the subsequent transfer of strength improvement to backstroke and freestyle sprint performances. Our data clearly shows a diminishing improvement the longer the race distance as well as a greater improvement in freestyle compared to backstroke performance. Overall, adding 90 min dryland training / week to ~7 hour/week swim schedule further improved freestyle ~2.1% and backstroke ~0.5% over and above the ~2.2% freestyle and ~2.5% backstroke improvement realized from swim training alone group. Our immediate transfer of dryland strength to swimming performance contrasts with findings of Amaro et al., [20] who found that their youth swimmers needed an adaptation period of 4 weeks before induced gains in dryland strength (from a 6-week dryland strength period) were successfully transferred to sprint freestyle performance.
The greater relative improvement in freestyle of the DS group is likely highly influenced by the ability to maintain a higher stroke rate, but will also be influenced by increased muscular power [21]. Interestingly, we speculate that the greater relative improvement in backstroke by DS is likely from increased muscular strength in each stroke and would assume a greater increase in distance per stroke compared to CONT. Reductions in exercising heart rate and reduced perceptions of exertion are clearly signs that swimmers in both groups improved their cardiovascular fitness. The dryland programme undertaken emphasised higher repetitions than traditional maximum strength-based programmes hence this particular programme may have provided some cardiovascular benefits for the DS group above those experienced by CONT, however the trend of increased benefits was not consistent across both strokes and distances.
Annual adolescent backstroke improvement has recently been quantified by age and for 50 and 100 m events. Males aged 12–13 years would be expected to have a mean improvement of ~5–6.9 % [22]. In comparison, our current DS group displayed an improvement of 1.6 - 4.4 % in only two months which emphasises the ability of dryland training to fast track backstroke swimming improvement. Modelling predicts sub-elite swimmers obtain the start of their peak performance between 18.5–19.8 years across a number of events (including 50 and 100 m freestyle and 100 m backstroke) and tends to coincide with biological maturity [23]. The rate of performance progression is known to be attributed to the tempo of anthropometric and physiological maturation [23] and this gives credence to the importance of starting strength training early [5]. Elite male sprint swimmers will reach a career peak performance at least 5 years later ~24–25 years – with a mean peak performance window of ~2.6 years [24]. It is speculated that after physical maturation further performance gains will come increasingly from biomechanical and psychological domains [23].
Dryland training provides an in-direct transfer of strength to swimming performance, however we have shown in this study using adolescent swimmers that dryland training is a time-efficient practice to improve swimming performance. Further study could match the training duration of an additional 90 min swimming per week with the time spent in dryland training, however we would suggest that the additional swimming time would be unlikely to result in the relative magnitude of improvement seen in the DS group (freestyle improvement doubled; backstroke improved ~20 % more). A limitation of our current study is that we were unable to specify where the improvements in race performance came from; utilising new accelerometer technologies future studies should look to specify the race components that benefited from improved dryland strength – i.e. start, surface speed, turns or finish. We also suggest researchers should focus on investigating exercises that potentially could give a better return on the strength transfer from dryland to backstroke performance by considering the specificity of training, these could include currently popular eccentric flywheel training activities. Further study should also seek to quantify the transfer of in-water resistance to improving swimming performance in adolescents – this data would help clarify the optimal combination of dryland to other training methodologies.
CONCLUSIONS
In conclusion, we have shown a varied programme of dryland exercises is effective for improving adolescent strength and this transfers to their swimming performance. The improvement is greater in freestyle than backstroke and is more effective for shorter compared to longer sprint distances.
Acknowledgements
The authors would like to thank Saudi Arabian Swimming Federation for providing access to the subjects. A special thanks goes to Coach Mowafak Almasri and the swimmers and coaches of the Jubbah club in Ha’il, Saudi Arabia for their commitment and enthusiasm.
Notes
Conflict of Interest
The authors declare no conflict of interest.