Using Structural Equation Modeling to Examine the Effects of Sex and Physical Activity on the Metabolic Syndrome and Health-related Quality of Life Relationship
Article information
Abstract
Objectives
The purpose of this study was to use structural equation modeling (SEM) to investigate the moderating effects of sex and the mediating effects of physical activity (PA) on the metabolic syndrome (MetS) and health-related quality of life (HRQOL) relationship.
Methods
The 2013-14 NHANES was used and included 1,077 adults 50+ years of age. A latent construct of MetS was created using five observed variables: waist circumference, HDL cholesterol, triglycerides, fasting glucose, and mean arterial pressure. A PA variable was created from self-reported moderate and vigorous recreational activity and converted to quartiles of moderate-to-vigorous PA minutes per week. HRQOL was assessed from a question regarding self-rated general health and dichotomized to indicate poor/good HRQOL.
Results
The MetS latent model showed adequate fit (χ2/df=2.47, GFI=0.99, CFI=0.99, and RMSEA=0.04) and significantly (P<.001) predicted all observed variables. The structural model also showed adequate fit with significant direct effects of MetS on HRQOL (β= −0.118, P<0.001) and PA on HRQOL (β=0.176, P<0.001). The effect of MetS on HRQOL (β= −0.048, P=0.001) through PA revealed that PA mediates the relationship. The multi-group analysis showed that the structural model was significantly different between males and females, with PA completely mediating the MetS and HRQOL relationship in males and partially mediating the relationship in females.
Conclusions
Results from this study support the use of SEM for investigating moderating and mediating effects while simultaneously measuring a latent construct. Additionally, PA was a stronger mediator to the MetS and HRQOL relationship in older males than in older females.
INTRODUCTION
Metabolic syndrome (MetS) is a clustering of risk factors for cardiovascular disease and diabetes which includes central obesity, raised blood pressure, dyslipidemia, and elevated fasting glucose [1]. More specifically, the Third Report of the Expert Panel on Detection, Evaluation, and Treatment of High Blood Cholesterol in Adults (ATP III), which is the National Cholesterol Education Program’s (NCEP) guidelines for cholesterol testing and management, defines MetS as having any three (3) of the following: large waist circumference (WC), elevated systolic (SBP) or diastolic blood pressure (DBP), elevated triglycerides, low high density lipoprotein (HDL), or elevated fasting blood glucose [2]. MetS has become a public health concern in recent years because of the dramatic increased risk of heart disease [3-5], stroke [6-8], diabetes [9-11], and mortality [12-14] among patients who suffer from it.
Health-related quality of life (HRQOL) is a broad measure that most often involves an individual’s subjective view of their own physical and/or mental health status [15]. HRQOL is an outcome measure commonly used in health science research, as well as studies related to physical activity (PA) [16]. And PA is a preventive health behavior associated with both HRQOL [17-19] and MetS [20-22]. Given these known associations between MetS, PA, and HRQOL, supporting evidence specifically showing how much PA facilitates the MetS and HRQOL relationship is limited. Additionally, few studies have investigated the extent to which sex moderates the mediating effects of PA on the MetS and HRQOL relationship. Therefore, the purpose of this study was to use structural equation modeling (SEM) to investigate the moderating effects of sex and the mediating effects of PA on the MetS and HRQOL relationship.
METHODS
Participants and Design
The 2013-14 National Health and Nutrition Examination Survey (NHANES) was used for this study. NHANES is a representative sample of all U.S. noninstitutionalized citizens conducted by the National Center for Health Statistics and Centers for Disease Control and Prevention [23]. Three types of data were collected from NHANES participants, including survey response data (e.g., demographics, smoking history, physical activity behavior, etc.), physical examination data (blood pressure, waist circumference, grip strength, etc.), and laboratory data (e.g., fasting blood glucose, HDL cholesterol, pregnancy test, etc.). This research used all three types of data, which were downloaded from four different NHANES component areas: Demographics, Examination, Laboratory, and Questionnaire. Data for this study were restricted to participants who had complete information for all relevant study variables and who were 50 years of age and older.
Measures
Four types of measures were used in this study: 1) MetS indicator variables, 2) PA, 3) HRQOL, and 4) control variables. MetS indicator variables included waist circumference (WC), high density lipoprotein (HDL) cholesterol, fasting blood glucose (GLUC), blood triglycerides (TRIG), and mean arterial pressure (MAP) [24]. WC was measured in centimeters (cm) by a trained NHANES health professional, measuring directly on the skin just above the uppermost lateral border of the right ilium at the midaxillary line. Blood pressure was also measured by a trained health professional and MAP was computed using mean values of systolic (SBP) and diastolic blood pressure (SBP) measurements and the following formula: MAP=(2*DBP+SBP)/3. Fasting blood samples were drawn by a health professional and HDL, GLUC, and TRIG measured by medical staff. Participants were categorized into quartiles relative to each MetS indicator variable (still referred to as WC, HDL, GLUC, TRIG, and MAP in all analyses), where the first quartile represents the individuals with the lowest values and the fourth quartile represents individuals with the highest values.
PA was assessed using self-reported data regarding usual recreational activity [25]. Vigorous recreational activity was assessed first from the following question: “In a typical week do you do any vigorous-intensity sports, fitness, or recreational activities that cause large increases in breathing or heart rate like running or basketball for at least 10 minutes continuously?”. Participants responding “yes” were then asked: “In a typical week, on how many days do you do vigorous-intensity sports, fitness or recreational activities?” followed by: “How much time do you spend doing vigorous-intensity sports, fitness or recreational activities on a typical day?”. Moderate recreational activity was assessed first from the following question: “In a typical week do you do any moderate-intensity sports, fitness, or recreational activities that cause a small increase in breathing or heart rate such as brisk walking, bicycling, swimming, or volleyball for at least 10 minutes continuously?”. Participants responding “yes” were then asked the same frequency and duration questions regarding moderate activity. Weekly minutes of moderate recreational activity (MPA) and minutes of vigorous recreational activity (VPA) were each computed by multiplying the reported number of days by the respective reported time in minutes. Finally, weekly moderate-to-vigorous recreational activity (MVPA) was computed as follows: MVPA=MPA+VPA*2. Thereafter, participants were categorized into quartiles of MVPA (still referred to as MVPA in all analyses), where the first quartile represents the least active individuals and the fourth quartile represents the most active individuals.
HRQOL was assessed using a single item from the Current Health Status section [26]. Specifically, general HRQOL was assessed from the following question: “Would you say your health in general is: Excellent, Very good, Good, Fair, or Poor?”. In this study, we dichotomized responses to create a good HRQOL (HRQOL=1: Excellent, Very good, and Good) group and poor HRQOL (HRQOL=0: Fair and Poor) group [27]. Control variables were used to control for possible confounding and included respondent age and sex.
Statistical Analysis
Descriptive statistics (means and standard deviations) were computed for all MetS indicator variables to describe the risk factor separation between the quartile groups. Both Pearson and Spearman correlation coefficients were computed to describe the interrelationship between the study variables. Since both sets of coefficients were similar, Pearson coefficients only were reported. The SEM analysis was performed in a series of steps, including 1) assessing the fit of the MetS measurement model, 2) assessing the fit of the MetS, MVPA, and HRQOL structural model, 3) assessing the mediating effect of MVPA on the MetS and HRQOL relationship, 4) assessing structural model differences between sex groups by running a multigroup test, 5) assessing the fit of each sex-specific structural model, 6) assessing the sex-specific mediating effect of MVPA on the MetS and HRQOL relationship. Model fit was assessed using the following statistics and criteria: comparative fit index (CFI>0.90), root mean square error of approximation (RMSEA<0.08), goodness of fit index (GFI>0.90), adjusted goodness of fit index (AGFI>0.90), Tucker-Lewis index (TLI>0.90), normed fit index (NFI>0.90), and Akaike’s information criterion (AIC, relatively lower values indicate better fit) [28]. As well, the chi-square statistic (χ2) to degrees of freedom (df) ratio (i.e., normed chi-square) was used with acceptable criteria of less than 5.0 [29]. Two different methods were used to test mediation, the Sobel statistic [30] and the Bias-corrected Bootstrap method [31]. SPSS and AMOS version 24 were used for SEM procedures [32,33]. SAS version 9.4 was used for all descriptive statistics [34].
RESULTS
Table 1 displays descriptive statistics of the MetS risk factors across the quartiles. By design, as each quartile increases from 1 (1st quartile) to 4 (4th quartile), participants scores increased. This would indicate that participants in the 4th quartile of each risk factor are at greatest risk for MetS, with exception of HDL, where the 1st quartile participants are at greatest risk. Table 2 displays a correlation matrix of study variables. All relevant variables were significantly (Ps<0.05) related to each other, with the exception of MAP, which was related only to GLUC and TRIG. Figure 1 displays the fitted MetS measurement model, which specifies that latent MetS causes WC, HDL, GLUC, TRIG, and MAP. This measurement model fit well (χ2 /df=2.47, GFI=0.99, CFI=0.99, and RMSEA=0.04) and significantly (Ps<0.001) predicted all observed variables (Table 3). The loadings indicate the positive relationship between MetS and its risk factors, except for HDL, which is negatively related. The displayed measurement model also reflects the correlation between two sets of error terms (WCerror with GLUCerror and HDLerror with MAPerror), which significantly improved model fit (Delta χ2 = 46.1, P<0.001).

Descriptive statistics of MetS risk factors across quartiles.
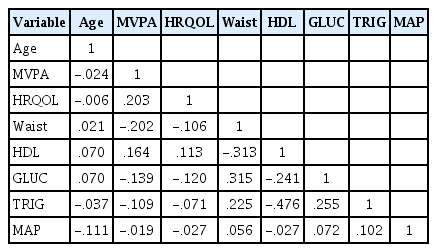
Correlation matrix containing study variables.
MetS measurement model.
MetS, metabolic syndrome; WC, waist circumference; HDL, high density lipoprotein; GLUC, fasting glucose; TRIG, triglycerides; MAP, mean arterial pressure. All loadings were significant (P<0.001).

MetS measurement model fit statistics.
Figure 2 displays the MetS structural model with latent MetS as the main independent variable, MVPA as the mediating variable, HRQOL as the dependent variable, and age and sex as control variables. The global structural model fit well (χ2/df=2.99, GFI=0.99, CFI=0.94, and RMSEA=0.04) and all hypothesized structural effects were significant (Ps<0.05) (Table 4). Both the Sobel (Z=−3.94, P<0.001) and Bootstrap (Beta=−0.048, P<0.001) mediation tests showed that MVPA significantly mediates the MetS and HRQOL relationship. Furthermore, the direct effect of Mets to HRQOL remained significant (P=0.001) during the mediation test, therefore, MVPA only partially mediated the relationship. Results of the multigroup test showed that sex significantly moderates the structural model (Delta χ2 =45.8, P<0.001). Additionally, sex differences were noted while specifically constraining only the hypothesized structural estimates (Delta χ2 =14.3, P=0.046). Therefore, sex-specific structural models were fit and assessed for MVPA mediation effects.

MetS structural model.
MetS, metabolic syndrome; WC, waist circumference; HDL, high density lipoprotein; GLUC, fasting glucose; TRIG, triglycerides; MAP, mean arterial pressure. MetS is a latent endogenous variable. MVPA is an observed endogenous variable. HRQOL is an observed endogenous variable. Age and sex are exogenous control variables. All MetS observed variables are endogenous. All error terms are latent and exogenous (disturbance). Single headed arrows represent direct effects. An indirect effect is seen when a variable has an arrow pointing toward it and pointing away from it (e.g., MVPA). Double headed arrows represent correlations. All effects in figure are standardized regression coefficients. All coefficients were significant (P<0.05). Sobel mediation statistic for MVPA mediating MetS to HRQOL: Z=(−0.501*0.095)/sqrt(0.0952*0.0902+0.5012*0.0172)=−3.94, with P<0.001. Bias-corrected bootstrap MVPA mediation estimate for MetS to HRQOL: −0.048, with 95% CI: −0.075 to −0.028 and P<0.001. The direct effect of Mets to HRQOL remained significant (P=0.001) during the mediation test, therefore MVPA partially mediated the relationship.

MetS structural model fit statistics.
Figure 3 displays the same structural model for males only. The global structural model did not fit as well (χ2/df=5.03, GFI=0.97, CFI=0.82, and RMSEA=0.09) (Table 5). All coefficients were significant (P<0.05), except for MetS to MAP and MetS to HRQOL. Both the Sobel (Z=−2.24, P=0.025) and Bootstrap (Beta=−0.033, P=0.007) mediation tests showed that MVPA significantly mediates the MetS and HRQOL relationship. However, the direct effect of Mets to HRQOL lost its significance (P=0.253) during the mediation test, therefore, MVPA completely mediated the relationship. Figure 4 displays the structural model for females only. The global structural model fit well (χ2/df=1.97, GFI=0.99, CFI=0.96, and RMSEA=0.04) (Table 5). Unlike the male model, all coefficients were significant (P<0.05) for the female model. Additionally, both the Sobel (Z=−2.93, P=0.003) and Bootstrap (Beta=−0.059, P=0.001) mediation tests showed that MVPA significantly mediates the MetS and HRQOL relationship. Unlike in the male model, the direct effect of Mets to HRQOL in the female model remained significant (P=0.002) during the mediation test, therefore, MVPA only partially mediated the relationship.
MetS structural model for males only.
All effects in figure are standardized regression coefficients. All coefficients were significant (P<0.05), except for MetS to MAP and MetS to HRQOL. Delta chi-square statistic between male and female models: 45.777, with P<0.001. Delta chi-square statistic between male and female models with structural estimates constrained: 14.326, with P=0.046. Sobel mediation statistic for MVPA mediating MetS to HRQOL in males: Z=(−0.322*0.101)/sqrt (0.1012*0.1 242+0.3222*0.0232)=−2.24, with P=0.025. Bias-corrected bootstrap MVPA mediation estimate for MetS to HRQOL: −0.033, with 95% CI: −0.068 to -0.010 and P=0.007. The direct effect of Mets to HRQOL lost significance (P=0.253) during the mediation test, therefore MVPA completely mediated the relationship.

MetS structural model fit statistics between males and females.
MetS structural model for females only.
All effects in figure are standardized regression coefficients. All coefficients were significant (P<0.05). Delta chi-square statistic between male and female models: 45.777, with P<0.001. Delta chi-square statistic between male and female models with structural estimates constrained: 14.326, with P=0.046. Sobel mediation statistic for MVPA mediating MetS to HRQOL in males: Z=(−0.692*0.086)/sqrt(0.0242*0.1362+0.6922*0.0242)=−2.93, with P=0.003. Bias-corrected bootstrap MVPA mediation estimate for MetS to HRQOL: −0.059, with 95% CI: −0.114 to −0.027 and P=0.001. The direct effect of Mets to HRQOL remained significant (P=0.002) during the mediation test, therefore MVPA partially mediated the relationship.
DISCUSSION
The purpose of this study was to use SEM to investigate the moderating effects of sex and the mediating effects of PA on the MetS and HRQOL relationship. The results showed clearly that PA in fact mediates the MetS and HRQOL relationship. Furthermore, findings showed differences in this established relationship between sex groups, with PA completely mediating the MetS and HRQOL relationship in males and partially mediating the relationship in females. To some extent, these findings are shown to be consistent with other studies. For example, a recent study using a representative sample of rural adults showed that females who are physically inactive are significantly more likely to report poor HRQOL than their male counterparts [18]. Therefore, the current study showing sex differences in the MetS, MVPA, and HRQOL relationship is a reasonable extension from published evidence. Another recent study, more similar to the current study, showed that PA was a significant mediator in the relationship between pain catastrophizing and quality of life [35]. Albeit, the main independent variable in this similar study was not MetS (it was pain catastrophizing), it does support the mediating role of PA when a debilitating illness leads to changes in HRQOL. A final study, also similar to the current study, examined the mediating role of PA on the relationship between social support and mental HRQOL [36]. The findings from this study also showed that PA significantly mediates the established relationship. Thus, the current study is the first of its kind showing that PA mediates the MetS and HRQOL relationship. Furthermore, these findings are supported well by published research.
The major strength of this study was its use of SEM to first assess a measurement of MetS and then subsequently examine its relationship with HRQOL through PA. To date, no published studies have used SEM to measure latent MetS and use the measure to examine the moderating effects of sex on the mediating effects of PA on the MetS and HRQOL relationship. However, this study has limitations worth discussing. One limitation is the use of laboratory measures of MetS risk factors only in the SEM study. This limits the results because there was no way to incorporate the fact that some study participants were using medications to lower such risk factor measures (e.g., blood pressure, cholesterol, etc.). Therefore, some participants in this study may have been measured low on the MetS latent trait when in fact they should have been measured high. Thus, results from this study should be considered in terms of actual MetS risk at time of survey interview, without regard to any risk factors that may have been controlled through prescribed medications. Another limitation worth mentioning was the use of self-reported recreational PA to measure MVPA. The bias in self-reported PA is well documented, with adults generally overestimating their MVPA [37-40]. Therefore, results from this study should be interpreted with caution.
CONCLUSIONS
Results from this study support the use of SEM for investigating moderating and mediating effects while simultaneously measuring a latent construct. Additionally, PA was a significant mediator in the MetS and HRQOL relationship in older adults. Furthermore, this study showed that PA completely mediates the MetS and HRQOL relationship in older males and partially mediates the relationship in older females. Health promotion strategies should focus on helping older adults with MetS adopt PA as a behavior to increase HRQOL, especially among older males.
Notes
Conflicts of interest
The authors declare no conflict of interest.